

Howard Marks put it nicely when he said that, rather than worrying about share price volatility, 'The possibility of permanent loss is the risk I worry about... and every practical investor I know worries about.' It's only natural to consider a company's balance sheet when you examine how risky it is, since debt is often involved when a business collapses. Importantly, Nexans S.A. (EPA:NEX) does carry debt. But the real question is whether this debt is making the company risky.
When Is Debt A Problem?
Debt assists a business until the business has trouble paying it off, either with new capital or with free cash flow. Part and parcel of capitalism is the process of 'creative destruction' where failed businesses are mercilessly liquidated by their bankers. While that is not too common, we often do see indebted companies permanently diluting shareholders because lenders force them to raise capital at a distressed price. By replacing dilution, though, debt can be an extremely good tool for businesses that need capital to invest in growth at high rates of return. When we think about a company's use of debt, we first look at cash and debt together.
Check out our latest analysis for Nexans
What Is Nexans's Debt?
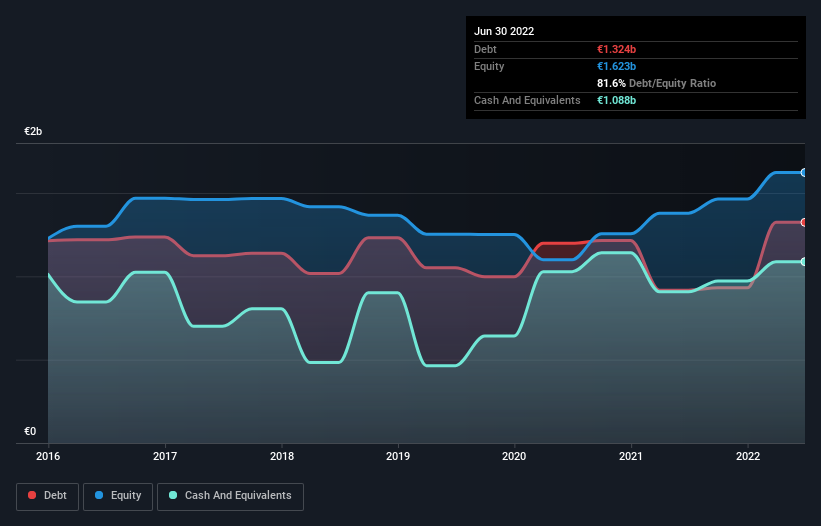
You can click the graphic below for the historical numbers, but it shows that as of June 2022 Nexans had €1.32b of debt, an increase on €917.0m, over one year. However, it also had €1.09b in cash, and so its net debt is €236.0m.
How Strong Is Nexans' Balance Sheet?
Zooming in on the latest balance sheet data, we can see that Nexans had liabilities of €3.50b due within 12 months and liabilities of €1.40b due beyond that. Offsetting these obligations, it had cash of €1.09b as well as receivables valued at €1.37b due within 12 months. So its liabilities outweigh the sum of its cash and (near-term) receivables by €2.44b.
This is a mountain of leverage relative to its market capitalization of €3.70b. This suggests shareholders would be heavily diluted if the company needed to shore up its balance sheet in a hurry.
We use two main ratios to inform us about debt levels relative to earnings. The first is net debt divided by earnings before interest, tax, depreciation, and amortization (EBITDA), while the second is how many times its earnings before interest and tax (EBIT) covers its interest expense (or its interest cover, for short). This way, we consider both the absolute quantum of the debt, as well as the interest rates paid on it.
Nexans's net debt is only 0.42 times its EBITDA. And its EBIT covers its interest expense a whopping 20.4 times over. So you could argue it is no more threatened by its debt than an elephant is by a mouse. And we also note warmly that Nexans grew its EBIT by 14% last year, making its debt load easier to handle. When analysing debt levels, the balance sheet is the obvious place to start. But it is future earnings, more than anything, that will determine Nexans's ability to maintain a healthy balance sheet going forward. So if you want to see what the professionals think, you might find this free report on analyst profit forecasts to be interesting.
Finally, while the tax-man may adore accounting profits, lenders only accept cold hard cash. So the logical step is to look at the proportion of that EBIT that is matched by actual free cash flow. Over the most recent three years, Nexans recorded free cash flow worth 75% of its EBIT, which is around normal, given free cash flow excludes interest and tax. This free cash flow puts the company in a good position to pay down debt, when appropriate.
Our View
Happily, Nexans's impressive interest cover implies it has the upper hand on its debt. But, on a more sombre note, we are a little concerned by its level of total liabilities. Taking all this data into account, it seems to us that Nexans takes a pretty sensible approach to debt. That means they are taking on a bit more risk, in the hope of boosting shareholder returns. Over time, share prices tend to follow earnings per share, so if you're interested in Nexans, you may well want to click here to check an interactive graph of its earnings per share history.
If you're interested in investing in businesses that can grow profits without the burden of debt, then check out this free list of growing businesses that have net cash on the balance sheet.
If you're looking to trade Nexans, open an account with the lowest-cost platform trusted by professionals, Interactive Brokers.
With clients in over 200 countries and territories, and access to 160 markets, IBKR lets you trade stocks, options, futures, forex, bonds and funds from a single integrated account.
Enjoy no hidden fees, no account minimums, and FX conversion rates as low as 0.03%, far better than what most brokers offer.
Sponsored ContentValuation is complex, but we're here to simplify it.
Discover if Nexans might be undervalued or overvalued with our detailed analysis, featuring fair value estimates, potential risks, dividends, insider trades, and its financial condition.
Access Free AnalysisHave feedback on this article? Concerned about the content? Get in touch with us directly. Alternatively, email editorial-team (at) simplywallst.com.
This article by Simply Wall St is general in nature. We provide commentary based on historical data and analyst forecasts only using an unbiased methodology and our articles are not intended to be financial advice. It does not constitute a recommendation to buy or sell any stock, and does not take account of your objectives, or your financial situation. We aim to bring you long-term focused analysis driven by fundamental data. Note that our analysis may not factor in the latest price-sensitive company announcements or qualitative material. Simply Wall St has no position in any stocks mentioned.
About ENXTPA:NEX
Nexans
Manufactures and sells cables in France, Canada, Norway, Germany, and internationally.
Undervalued with excellent balance sheet.
Similar Companies
Market Insights

Community Narratives

