
Advertisement
This article is written for those who want to get better at using price to earnings ratios (P/E ratios). We'll look at Legrand SA's (EPA:LR) P/E ratio and reflect on what it tells us about the company's share price. Legrand has a price to earnings ratio of 22.09, based on the last twelve months. That means that at current prices, buyers pay €22.09 for every €1 in trailing yearly profits.
See our latest analysis for Legrand
How Do I Calculate Legrand's Price To Earnings Ratio?
The formula for price to earnings is:
Price to Earnings Ratio = Price per Share ÷ Earnings per Share (EPS)
Or for Legrand:
P/E of 22.09 = €66.00 ÷ €2.99 (Based on the trailing twelve months to June 2019.)
Is A High P/E Ratio Good?
The higher the P/E ratio, the higher the price tag of a business, relative to its trailing earnings. That is not a good or a bad thing per se, but a high P/E does imply buyers are optimistic about the future.
How Does Legrand's P/E Ratio Compare To Its Peers?
The P/E ratio indicates whether the market has higher or lower expectations of a company. The image below shows that Legrand has a higher P/E than the average (19.4) P/E for companies in the electrical industry.
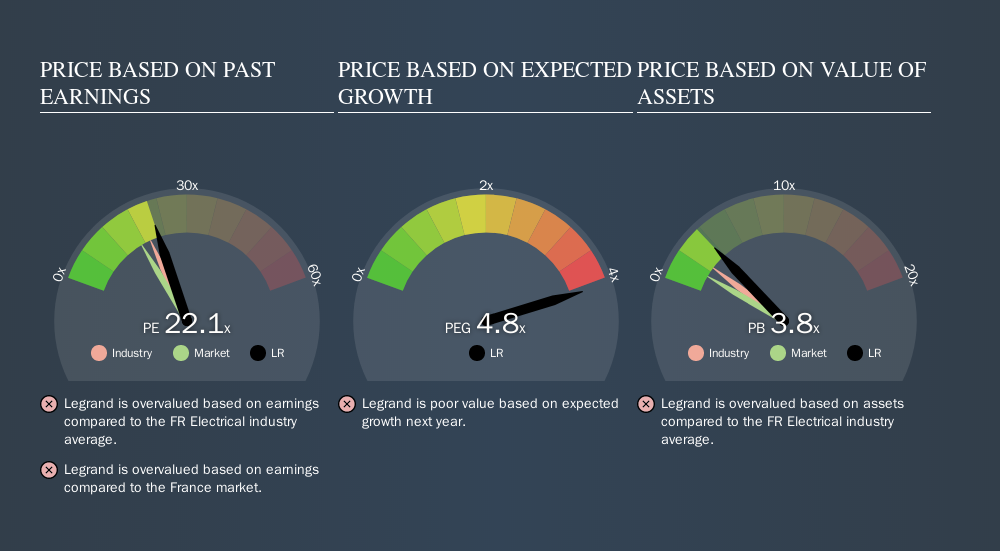
Legrand's P/E tells us that market participants think the company will perform better than its industry peers, going forward.
How Growth Rates Impact P/E Ratios
P/E ratios primarily reflect market expectations around earnings growth rates. If earnings are growing quickly, then the 'E' in the equation will increase faster than it would otherwise. That means unless the share price increases, the P/E will reduce in a few years. So while a stock may look expensive based on past earnings, it could be cheap based on future earnings.
Legrand had pretty flat EPS growth in the last year. But EPS is up 8.4% over the last 5 years. Shareholders have some reason to be optimistic, but the future is always uncertain. So further research is always essential. I often monitor director buying and selling.
Remember: P/E Ratios Don't Consider The Balance Sheet
The 'Price' in P/E reflects the market capitalization of the company. That means it doesn't take debt or cash into account. In theory, a company can lower its future P/E ratio by using cash or debt to invest in growth.
Such spending might be good or bad, overall, but the key point here is that you need to look at debt to understand the P/E ratio in context.
So What Does Legrand's Balance Sheet Tell Us?
Net debt totals 15% of Legrand's market cap. It would probably deserve a higher P/E ratio if it was net cash, since it would have more options for growth.
The Verdict On Legrand's P/E Ratio
Legrand's P/E is 22.1 which is above average (16.8) in its market. Given the debt is only modest, and earnings are already moving in the right direction, it's not surprising that the market expects continued improvement.
Investors should be looking to buy stocks that the market is wrong about. People often underestimate remarkable growth -- so investors can make money when fast growth is not fully appreciated. So this free report on the analyst consensus forecasts could help you make a master move on this stock.
But note: Legrand may not be the best stock to buy. So take a peek at this free list of interesting companies with strong recent earnings growth (and a P/E ratio below 20).
We aim to bring you long-term focused research analysis driven by fundamental data. Note that our analysis may not factor in the latest price-sensitive company announcements or qualitative material.
If you spot an error that warrants correction, please contact the editor at editorial-team@simplywallst.com. This article by Simply Wall St is general in nature. It does not constitute a recommendation to buy or sell any stock, and does not take account of your objectives, or your financial situation. Simply Wall St has no position in the stocks mentioned. Thank you for reading.
About ENXTPA:LR
Legrand
Manufactures, distributes, and sells electrical and digital building infrastructures in Europe, North and Central America, and internationally.
Solid track record with adequate balance sheet and pays a dividend.
Similar Companies
Market Insights

Advertisement
Community Narratives
Finding The True Value Of A Logistics Powerhouse
Fair Value US$95.21|8.5% undervalued
NV
Community Contributor
Paradigm Biopharmaceuticals Will Lead Osteoarthritis Treatment with Zilosul's FDA Success
Fair Value AU$5.50|91.8% undervalued
AM
Community Contributor
Barrick Mining (ABX:CA): A Gold Hedge against a U.S. Shutdown
Fair Value CA$60.00|26.5% undervalued
GM
Community Contributor