
Advertisement
Investors can buy low cost index fund if they want to receive the average market return. But in any diversified portfolio of stocks, you'll see some that fall short of the average. For example, the Bouygues SA (EPA:EN) share price return of 16% over three years lags the market return in the same period. Unfortunately, the share price has fallen 13% over twelve months.
See our latest analysis for Bouygues
There is no denying that markets are sometimes efficient, but prices do not always reflect underlying business performance. One flawed but reasonable way to assess how sentiment around a company has changed is to compare the earnings per share (EPS) with the share price.
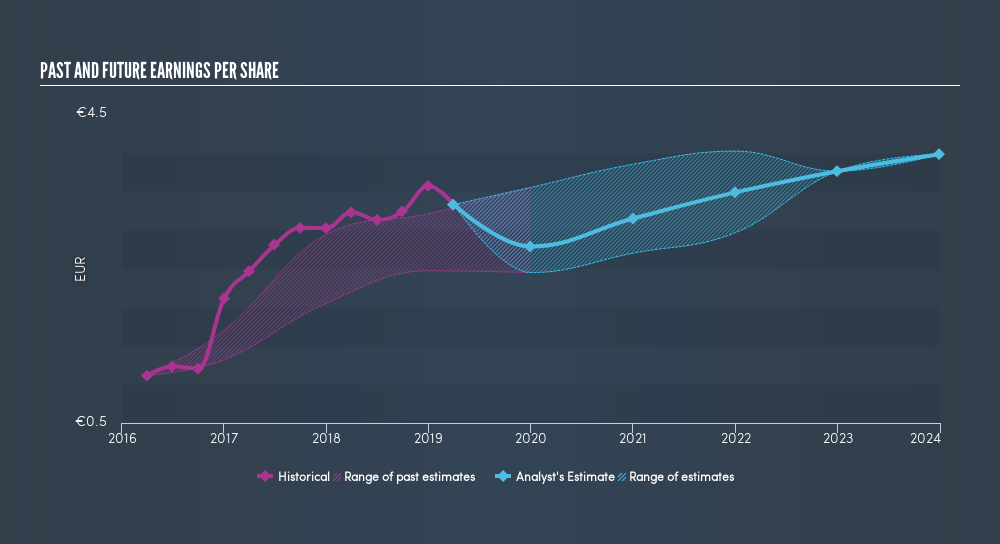
During three years of share price growth, Bouygues achieved compound earnings per share growth of 44% per year. The average annual share price increase of 5.0% is actually lower than the EPS growth. Therefore, it seems the market has moderated its expectations for growth, somewhat. This cautious sentiment is reflected in its (fairly low) P/E ratio of 9.70.
It is of course excellent to see how Bouygues has grown profits over the years, but the future is more important for shareholders. This free interactive report on Bouygues's balance sheet strength is a great place to start, if you want to investigate the stock further.
What About Dividends?
It is important to consider the total shareholder return, as well as the share price return, for any given stock. The TSR is a return calculation that accounts for the value of cash dividends (assuming that any dividend received was reinvested) and the calculated value of any discounted capital raisings and spin-offs. Arguably, the TSR gives a more comprehensive picture of the return generated by a stock. We note that for Bouygues the TSR over the last 3 years was 32%, which is better than the share price return mentioned above. This is largely a result of its dividend payments!
A Different Perspective
Bouygues shareholders are down 9.0% for the year (even including dividends), but the market itself is up 1.6%. Even the share prices of good stocks drop sometimes, but we want to see improvements in the fundamental metrics of a business, before getting too interested. On the bright side, long term shareholders have made money, with a gain of 7.2% per year over half a decade. It could be that the recent sell-off is an opportunity, so it may be worth checking the fundamental data for signs of a long term growth trend. Keeping this in mind, a solid next step might be to take a look at Bouygues's dividend track record. This free interactive graph is a great place to start.
For those who like to find winning investments this free list of growing companies with recent insider purchasing, could be just the ticket.
Please note, the market returns quoted in this article reflect the market weighted average returns of stocks that currently trade on FR exchanges.
We aim to bring you long-term focused research analysis driven by fundamental data. Note that our analysis may not factor in the latest price-sensitive company announcements or qualitative material.
If you spot an error that warrants correction, please contact the editor at editorial-team@simplywallst.com. This article by Simply Wall St is general in nature. It does not constitute a recommendation to buy or sell any stock, and does not take account of your objectives, or your financial situation. Simply Wall St has no position in the stocks mentioned. Thank you for reading.
About ENXTPA:EN
Bouygues
Operates in the construction, energy, telecom, media, and transport infrastructure sectors in France and internationally.
Established dividend payer and good value.
Similar Companies
Market Insights

Advertisement
Community Narratives
The "Molecular Pencil": Why Beam's Technology is Built to Win
Fair Value US$65.01|65.8% undervalued
DA
Community Contributor
The silent giant behind virtually every advanced chip powering AI, smartphones, and modern infrastructure.
Fair Value US$310.00|7.6% undervalued
OS
Community Contributor
ADP Stock: Solid Fundamentals, But AI Investments Test Its Margin Resilience
Fair Value US$387.77|34.5% undervalued
YI
Community Contributor