Poujoulat (EPA:ALPJT) sheds 13% this week, as yearly returns fall more in line with earnings growth


Poujoulat SA (EPA:ALPJT) shareholders have seen the share price descend 17% over the month. But over the last three years the stock has shone bright like a diamond. Over that time, we've been excited to watch the share price climb an impressive 355%. So you might argue that the recent reduction in the share price is unremarkable in light of the longer term performance. The thing to consider is whether there is still too much elation around the company's prospects.
In light of the stock dropping 13% in the past week, we want to investigate the longer term story, and see if fundamentals have been the driver of the company's positive three-year return.
See our latest analysis for Poujoulat
There is no denying that markets are sometimes efficient, but prices do not always reflect underlying business performance. One flawed but reasonable way to assess how sentiment around a company has changed is to compare the earnings per share (EPS) with the share price.
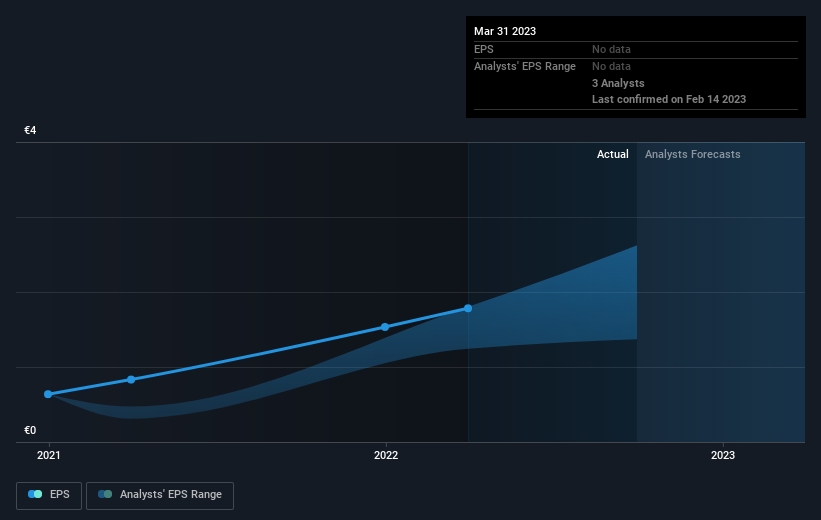
During three years of share price growth, Poujoulat achieved compound earnings per share growth of 144% per year. This EPS growth is higher than the 66% average annual increase in the share price. Therefore, it seems the market has moderated its expectations for growth, somewhat. We'd venture the lowish P/E ratio of 9.05 also reflects the negative sentiment around the stock.
The company's earnings per share (over time) is depicted in the image below (click to see the exact numbers).
We're pleased to report that the CEO is remunerated more modestly than most CEOs at similarly capitalized companies. It's always worth keeping an eye on CEO pay, but a more important question is whether the company will grow earnings throughout the years. Before buying or selling a stock, we always recommend a close examination of historic growth trends, available here..
What About Dividends?
It is important to consider the total shareholder return, as well as the share price return, for any given stock. Whereas the share price return only reflects the change in the share price, the TSR includes the value of dividends (assuming they were reinvested) and the benefit of any discounted capital raising or spin-off. It's fair to say that the TSR gives a more complete picture for stocks that pay a dividend. As it happens, Poujoulat's TSR for the last 3 years was 375%, which exceeds the share price return mentioned earlier. The dividends paid by the company have thusly boosted the total shareholder return.
A Different Perspective
We're pleased to report that Poujoulat shareholders have received a total shareholder return of 36% over one year. That's including the dividend. Since the one-year TSR is better than the five-year TSR (the latter coming in at 21% per year), it would seem that the stock's performance has improved in recent times. Someone with an optimistic perspective could view the recent improvement in TSR as indicating that the business itself is getting better with time. I find it very interesting to look at share price over the long term as a proxy for business performance. But to truly gain insight, we need to consider other information, too. Even so, be aware that Poujoulat is showing 1 warning sign in our investment analysis , you should know about...
But note: Poujoulat may not be the best stock to buy. So take a peek at this free list of interesting companies with past earnings growth (and further growth forecast).
Please note, the market returns quoted in this article reflect the market weighted average returns of stocks that currently trade on French exchanges.
New: Manage All Your Stock Portfolios in One Place
We've created the ultimate portfolio companion for stock investors, and it's free.
• Connect an unlimited number of Portfolios and see your total in one currency
• Be alerted to new Warning Signs or Risks via email or mobile
• Track the Fair Value of your stocks
Have feedback on this article? Concerned about the content? Get in touch with us directly. Alternatively, email editorial-team (at) simplywallst.com.
This article by Simply Wall St is general in nature. We provide commentary based on historical data and analyst forecasts only using an unbiased methodology and our articles are not intended to be financial advice. It does not constitute a recommendation to buy or sell any stock, and does not take account of your objectives, or your financial situation. We aim to bring you long-term focused analysis driven by fundamental data. Note that our analysis may not factor in the latest price-sensitive company announcements or qualitative material. Simply Wall St has no position in any stocks mentioned.
About ENXTPA:ALPJT
Poujoulat
Manufactures and sells metal chimneys and stacks for individual homes, collective housing, and new built and renovation industry in France and internationally.
Excellent balance sheet with reasonable growth potential.
Market Insights

Community Narratives

