
Advertisement
Caisse régionale de Crédit Agricole Mutuel Atlantique Vendée (EPA:CRAV) sheds €52m, company earnings and investor returns have been trending downwards for past five years
For many, the main point of investing is to generate higher returns than the overall market. But every investor is virtually certain to have both over-performing and under-performing stocks. So we wouldn't blame long term Caisse régionale de Crédit Agricole Mutuel Atlantique Vendée (EPA:CRAV) shareholders for doubting their decision to hold, with the stock down 39% over a half decade. Shareholders have had an even rougher run lately, with the share price down 16% in the last 90 days.
Since Caisse régionale de Crédit Agricole Mutuel Atlantique Vendée has shed €52m from its value in the past 7 days, let's see if the longer term decline has been driven by the business' economics.
View our latest analysis for Caisse régionale de Crédit Agricole Mutuel Atlantique Vendée
In his essay The Superinvestors of Graham-and-Doddsville Warren Buffett described how share prices do not always rationally reflect the value of a business. By comparing earnings per share (EPS) and share price changes over time, we can get a feel for how investor attitudes to a company have morphed over time.
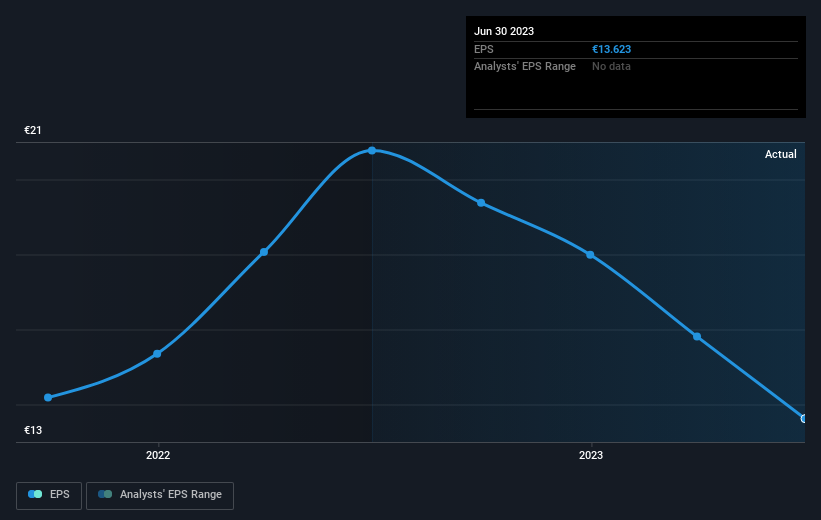
Looking back five years, both Caisse régionale de Crédit Agricole Mutuel Atlantique Vendée's share price and EPS declined; the latter at a rate of 0.6% per year. This reduction in EPS is less than the 10% annual reduction in the share price. So it seems the market was too confident about the business, in the past. The low P/E ratio of 5.88 further reflects this reticence.
The company's earnings per share (over time) is depicted in the image below (click to see the exact numbers).
Before buying or selling a stock, we always recommend a close examination of historic growth trends, available here.
What About Dividends?
It is important to consider the total shareholder return, as well as the share price return, for any given stock. The TSR is a return calculation that accounts for the value of cash dividends (assuming that any dividend received was reinvested) and the calculated value of any discounted capital raisings and spin-offs. Arguably, the TSR gives a more comprehensive picture of the return generated by a stock. In the case of Caisse régionale de Crédit Agricole Mutuel Atlantique Vendée, it has a TSR of -27% for the last 5 years. That exceeds its share price return that we previously mentioned. This is largely a result of its dividend payments!
A Different Perspective
It's good to see that Caisse régionale de Crédit Agricole Mutuel Atlantique Vendée has rewarded shareholders with a total shareholder return of 17% in the last twelve months. That's including the dividend. Notably the five-year annualised TSR loss of 5% per year compares very unfavourably with the recent share price performance. We generally put more weight on the long term performance over the short term, but the recent improvement could hint at a (positive) inflection point within the business. I find it very interesting to look at share price over the long term as a proxy for business performance. But to truly gain insight, we need to consider other information, too. Take risks, for example - Caisse régionale de Crédit Agricole Mutuel Atlantique Vendée has 1 warning sign we think you should be aware of.
Of course, you might find a fantastic investment by looking elsewhere. So take a peek at this free list of companies we expect will grow earnings.
Please note, the market returns quoted in this article reflect the market weighted average returns of stocks that currently trade on French exchanges.
New: AI Stock Screener & Alerts
Our new AI Stock Screener scans the market every day to uncover opportunities.
• Dividend Powerhouses (3%+ Yield)
• Undervalued Small Caps with Insider Buying
• High growth Tech and AI Companies
Or build your own from over 50 metrics.
Have feedback on this article? Concerned about the content? Get in touch with us directly. Alternatively, email editorial-team (at) simplywallst.com.
This article by Simply Wall St is general in nature. We provide commentary based on historical data and analyst forecasts only using an unbiased methodology and our articles are not intended to be financial advice. It does not constitute a recommendation to buy or sell any stock, and does not take account of your objectives, or your financial situation. We aim to bring you long-term focused analysis driven by fundamental data. Note that our analysis may not factor in the latest price-sensitive company announcements or qualitative material. Simply Wall St has no position in any stocks mentioned.
About ENXTPA:CRAV
Caisse régionale de Crédit Agricole Mutuel Atlantique Vendée
Provides banking products and services in France.
Flawless balance sheet with questionable track record.
Market Insights

Advertisement
Community Narratives
Finding The True Value Of A Logistics Powerhouse
Fair Value US$95.21|8.4% undervalued
NV
Community Contributor
Paradigm Biopharmaceuticals Will Lead Osteoarthritis Treatment with Zilosul's FDA Success
Fair Value AU$5.50|92.1% undervalued
AM
Community Contributor
Barrick Mining (ABX:CA): A Gold Hedge against a U.S. Shutdown
Fair Value CA$60.00|24.2% undervalued
GM
Community Contributor