

The external fund manager backed by Berkshire Hathaway's Charlie Munger, Li Lu, makes no bones about it when he says 'The biggest investment risk is not the volatility of prices, but whether you will suffer a permanent loss of capital.' When we think about how risky a company is, we always like to look at its use of debt, since debt overload can lead to ruin. As with many other companies Sanoma Oyj (HEL:SANOMA) makes use of debt. But the more important question is: how much risk is that debt creating?
Why Does Debt Bring Risk?
Debt assists a business until the business has trouble paying it off, either with new capital or with free cash flow. Ultimately, if the company can't fulfill its legal obligations to repay debt, shareholders could walk away with nothing. However, a more frequent (but still costly) occurrence is where a company must issue shares at bargain-basement prices, permanently diluting shareholders, just to shore up its balance sheet. Having said that, the most common situation is where a company manages its debt reasonably well - and to its own advantage. When we think about a company's use of debt, we first look at cash and debt together.
Check out our latest analysis for Sanoma Oyj
What Is Sanoma Oyj's Debt?
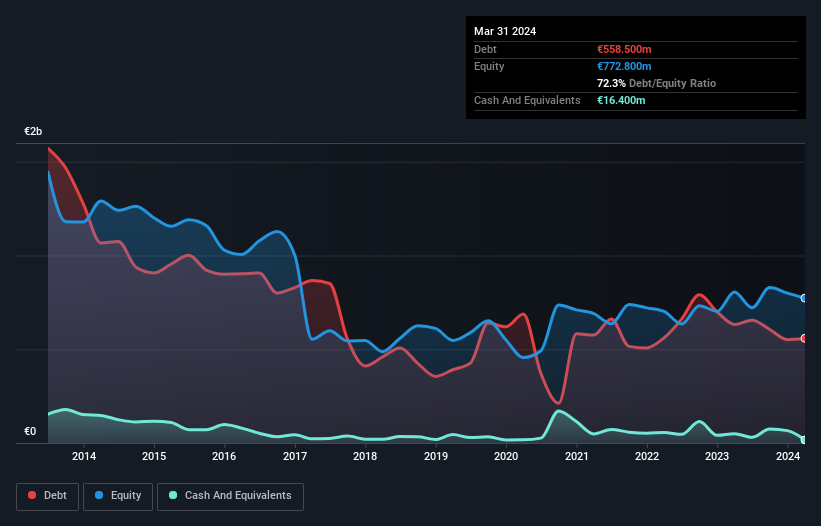
The image below, which you can click on for greater detail, shows that Sanoma Oyj had debt of €558.5m at the end of March 2024, a reduction from €632.4m over a year. However, it does have €16.4m in cash offsetting this, leading to net debt of about €542.1m.
How Strong Is Sanoma Oyj's Balance Sheet?
Zooming in on the latest balance sheet data, we can see that Sanoma Oyj had liabilities of €616.7m due within 12 months and liabilities of €586.3m due beyond that. Offsetting this, it had €16.4m in cash and €147.9m in receivables that were due within 12 months. So it has liabilities totalling €1.04b more than its cash and near-term receivables, combined.
This deficit is considerable relative to its market capitalization of €1.18b, so it does suggest shareholders should keep an eye on Sanoma Oyj's use of debt. This suggests shareholders would be heavily diluted if the company needed to shore up its balance sheet in a hurry.
We use two main ratios to inform us about debt levels relative to earnings. The first is net debt divided by earnings before interest, tax, depreciation, and amortization (EBITDA), while the second is how many times its earnings before interest and tax (EBIT) covers its interest expense (or its interest cover, for short). The advantage of this approach is that we take into account both the absolute quantum of debt (with net debt to EBITDA) and the actual interest expenses associated with that debt (with its interest cover ratio).
While Sanoma Oyj's debt to EBITDA ratio (2.8) suggests that it uses some debt, its interest cover is very weak, at 2.4, suggesting high leverage. In large part that's due to the company's significant depreciation and amortisation charges, which arguably mean its EBITDA is a very generous measure of earnings, and its debt may be more of a burden than it first appears. So shareholders should probably be aware that interest expenses appear to have really impacted the business lately. Even worse, Sanoma Oyj saw its EBIT tank 30% over the last 12 months. If earnings continue to follow that trajectory, paying off that debt load will be harder than convincing us to run a marathon in the rain. The balance sheet is clearly the area to focus on when you are analysing debt. But it is future earnings, more than anything, that will determine Sanoma Oyj's ability to maintain a healthy balance sheet going forward. So if you're focused on the future you can check out this free report showing analyst profit forecasts.
But our final consideration is also important, because a company cannot pay debt with paper profits; it needs cold hard cash. So the logical step is to look at the proportion of that EBIT that is matched by actual free cash flow. Over the last three years, Sanoma Oyj actually produced more free cash flow than EBIT. That sort of strong cash conversion gets us as excited as the crowd when the beat drops at a Daft Punk concert.
Our View
Mulling over Sanoma Oyj's attempt at (not) growing its EBIT, we're certainly not enthusiastic. But at least it's pretty decent at converting EBIT to free cash flow; that's encouraging. Once we consider all the factors above, together, it seems to us that Sanoma Oyj's debt is making it a bit risky. Some people like that sort of risk, but we're mindful of the potential pitfalls, so we'd probably prefer it carry less debt. The balance sheet is clearly the area to focus on when you are analysing debt. But ultimately, every company can contain risks that exist outside of the balance sheet. These risks can be hard to spot. Every company has them, and we've spotted 4 warning signs for Sanoma Oyj (of which 1 is a bit unpleasant!) you should know about.
Of course, if you're the type of investor who prefers buying stocks without the burden of debt, then don't hesitate to discover our exclusive list of net cash growth stocks, today.
New: Manage All Your Stock Portfolios in One Place
We've created the ultimate portfolio companion for stock investors, and it's free.
• Connect an unlimited number of Portfolios and see your total in one currency
• Be alerted to new Warning Signs or Risks via email or mobile
• Track the Fair Value of your stocks
Have feedback on this article? Concerned about the content? Get in touch with us directly. Alternatively, email editorial-team (at) simplywallst.com.
This article by Simply Wall St is general in nature. We provide commentary based on historical data and analyst forecasts only using an unbiased methodology and our articles are not intended to be financial advice. It does not constitute a recommendation to buy or sell any stock, and does not take account of your objectives, or your financial situation. We aim to bring you long-term focused analysis driven by fundamental data. Note that our analysis may not factor in the latest price-sensitive company announcements or qualitative material. Simply Wall St has no position in any stocks mentioned.
About HLSE:SANOMA
Sanoma Oyj
Operates as a media and learning company in Finland, the Netherlands, Poland, Spain, Belgium, and internationally.
Moderate growth potential with acceptable track record.
Similar Companies
Market Insights

Community Narratives

