

Key Insights
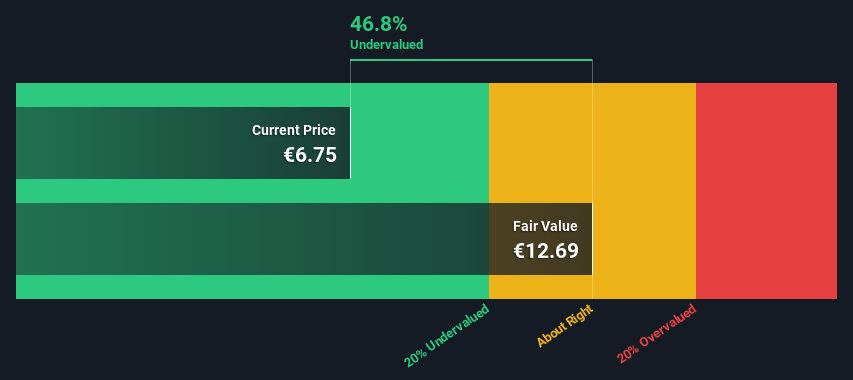
- Using the 2 Stage Free Cash Flow to Equity, Sanoma Oyj fair value estimate is €12.69
- Sanoma Oyj's €6.75 share price signals that it might be 47% undervalued
- Analyst price target for SANOMA is €8.48 which is 33% below our fair value estimate
Today we'll do a simple run through of a valuation method used to estimate the attractiveness of Sanoma Oyj (HEL:SANOMA) as an investment opportunity by estimating the company's future cash flows and discounting them to their present value. The Discounted Cash Flow (DCF) model is the tool we will apply to do this. Don't get put off by the jargon, the math behind it is actually quite straightforward.
Companies can be valued in a lot of ways, so we would point out that a DCF is not perfect for every situation. If you still have some burning questions about this type of valuation, take a look at the Simply Wall St analysis model.
Check out our latest analysis for Sanoma Oyj
The Method
We use what is known as a 2-stage model, which simply means we have two different periods of growth rates for the company's cash flows. Generally the first stage is higher growth, and the second stage is a lower growth phase. In the first stage we need to estimate the cash flows to the business over the next ten years. Where possible we use analyst estimates, but when these aren't available we extrapolate the previous free cash flow (FCF) from the last estimate or reported value. We assume companies with shrinking free cash flow will slow their rate of shrinkage, and that companies with growing free cash flow will see their growth rate slow, over this period. We do this to reflect that growth tends to slow more in the early years than it does in later years.
A DCF is all about the idea that a dollar in the future is less valuable than a dollar today, so we discount the value of these future cash flows to their estimated value in today's dollars:
10-year free cash flow (FCF) forecast
| 2024 | 2025 | 2026 | 2027 | 2028 | 2029 | 2030 | 2031 | 2032 | 2033 | |
| Levered FCF (€, Millions) | €115.0m | €145.3m | €157.0m | €132.0m | €141.0m | €138.7m | €137.5m | €137.0m | €136.9m | €137.2m |
| Growth Rate Estimate Source | Analyst x3 | Analyst x3 | Analyst x1 | Analyst x1 | Analyst x1 | Est @ -1.61% | Est @ -0.89% | Est @ -0.38% | Est @ -0.03% | Est @ 0.22% |
| Present Value (€, Millions) Discounted @ 7.1% | €107 | €127 | €128 | €100 | €100 | €92.0 | €85.1 | €79.2 | €73.9 | €69.2 |
("Est" = FCF growth rate estimated by Simply Wall St)
Present Value of 10-year Cash Flow (PVCF) = €962m
We now need to calculate the Terminal Value, which accounts for all the future cash flows after this ten year period. The Gordon Growth formula is used to calculate Terminal Value at a future annual growth rate equal to the 5-year average of the 10-year government bond yield of 0.8%. We discount the terminal cash flows to today's value at a cost of equity of 7.1%.
Terminal Value (TV)= FCF2033 × (1 + g) ÷ (r – g) = €137m× (1 + 0.8%) ÷ (7.1%– 0.8%) = €2.2b
Present Value of Terminal Value (PVTV)= TV / (1 + r)10= €2.2b÷ ( 1 + 7.1%)10= €1.1b
The total value is the sum of cash flows for the next ten years plus the discounted terminal value, which results in the Total Equity Value, which in this case is €2.1b. The last step is to then divide the equity value by the number of shares outstanding. Compared to the current share price of €6.8, the company appears quite good value at a 47% discount to where the stock price trades currently. Remember though, that this is just an approximate valuation, and like any complex formula - garbage in, garbage out.
The Assumptions
The calculation above is very dependent on two assumptions. The first is the discount rate and the other is the cash flows. If you don't agree with these result, have a go at the calculation yourself and play with the assumptions. The DCF also does not consider the possible cyclicality of an industry, or a company's future capital requirements, so it does not give a full picture of a company's potential performance. Given that we are looking at Sanoma Oyj as potential shareholders, the cost of equity is used as the discount rate, rather than the cost of capital (or weighted average cost of capital, WACC) which accounts for debt. In this calculation we've used 7.1%, which is based on a levered beta of 1.121. Beta is a measure of a stock's volatility, compared to the market as a whole. We get our beta from the industry average beta of globally comparable companies, with an imposed limit between 0.8 and 2.0, which is a reasonable range for a stable business.
SWOT Analysis for Sanoma Oyj
- Debt is well covered by cash flow.
- Earnings declined over the past year.
- Interest payments on debt are not well covered.
- Dividend is low compared to the top 25% of dividend payers in the Media market.
- Annual earnings are forecast to grow faster than the Finnish market.
- Good value based on P/E ratio and estimated fair value.
- Dividends are not covered by earnings.
- Annual revenue is expected to decline over the next 4 years.
Looking Ahead:
Although the valuation of a company is important, it ideally won't be the sole piece of analysis you scrutinize for a company. The DCF model is not a perfect stock valuation tool. Instead the best use for a DCF model is to test certain assumptions and theories to see if they would lead to the company being undervalued or overvalued. If a company grows at a different rate, or if its cost of equity or risk free rate changes sharply, the output can look very different. Why is the intrinsic value higher than the current share price? For Sanoma Oyj, there are three pertinent elements you should consider:
- Risks: You should be aware of the 3 warning signs for Sanoma Oyj (1 shouldn't be ignored!) we've uncovered before considering an investment in the company.
- Future Earnings: How does SANOMA's growth rate compare to its peers and the wider market? Dig deeper into the analyst consensus number for the upcoming years by interacting with our free analyst growth expectation chart.
- Other Solid Businesses: Low debt, high returns on equity and good past performance are fundamental to a strong business. Why not explore our interactive list of stocks with solid business fundamentals to see if there are other companies you may not have considered!
PS. Simply Wall St updates its DCF calculation for every Finnish stock every day, so if you want to find the intrinsic value of any other stock just search here.
If you're looking to trade Sanoma Oyj, open an account with the lowest-cost platform trusted by professionals, Interactive Brokers.
With clients in over 200 countries and territories, and access to 160 markets, IBKR lets you trade stocks, options, futures, forex, bonds and funds from a single integrated account.
Enjoy no hidden fees, no account minimums, and FX conversion rates as low as 0.03%, far better than what most brokers offer.
Sponsored ContentNew: Manage All Your Stock Portfolios in One Place
We've created the ultimate portfolio companion for stock investors, and it's free.
• Connect an unlimited number of Portfolios and see your total in one currency
• Be alerted to new Warning Signs or Risks via email or mobile
• Track the Fair Value of your stocks
Have feedback on this article? Concerned about the content? Get in touch with us directly. Alternatively, email editorial-team (at) simplywallst.com.
This article by Simply Wall St is general in nature. We provide commentary based on historical data and analyst forecasts only using an unbiased methodology and our articles are not intended to be financial advice. It does not constitute a recommendation to buy or sell any stock, and does not take account of your objectives, or your financial situation. We aim to bring you long-term focused analysis driven by fundamental data. Note that our analysis may not factor in the latest price-sensitive company announcements or qualitative material. Simply Wall St has no position in any stocks mentioned.
About HLSE:SANOMA
Sanoma Oyj
Operates as a media and learning company in Finland, the Netherlands, Poland, Spain, Belgium, and internationally.
Moderate growth potential with acceptable track record.
Similar Companies
Market Insights

Community Narratives

