
Advertisement
Here's How P/E Ratios Can Help Us Understand Keskisuomalainen Oyj (HEL:KSLAV)

This article is written for those who want to get better at using price to earnings ratios (P/E ratios). We'll look at Keskisuomalainen Oyj's (HEL:KSLAV) P/E ratio and reflect on what it tells us about the company's share price. Looking at earnings over the last twelve months, Keskisuomalainen Oyj has a P/E ratio of 18.5. That means that at current prices, buyers pay €18.5 for every €1 in trailing yearly profits.
See our latest analysis for Keskisuomalainen Oyj
How Do I Calculate A Price To Earnings Ratio?
The formula for P/E is:
Price to Earnings Ratio = Price per Share ÷ Earnings per Share (EPS)
Or for Keskisuomalainen Oyj:
P/E of 18.5 = €9.5 ÷ €0.51 (Based on the trailing twelve months to December 2018.)
Is A High Price-to-Earnings Ratio Good?
The higher the P/E ratio, the higher the price tag of a business, relative to its trailing earnings. All else being equal, it's better to pay a low price -- but as Warren Buffett said, 'It's far better to buy a wonderful company at a fair price than a fair company at a wonderful price.'
Does Keskisuomalainen Oyj Have A Relatively High Or Low P/E For Its Industry?
The P/E ratio essentially measures market expectations of a company. If you look at the image below, you can see Keskisuomalainen Oyj has a lower P/E than the average (21.2) in the media industry classification.
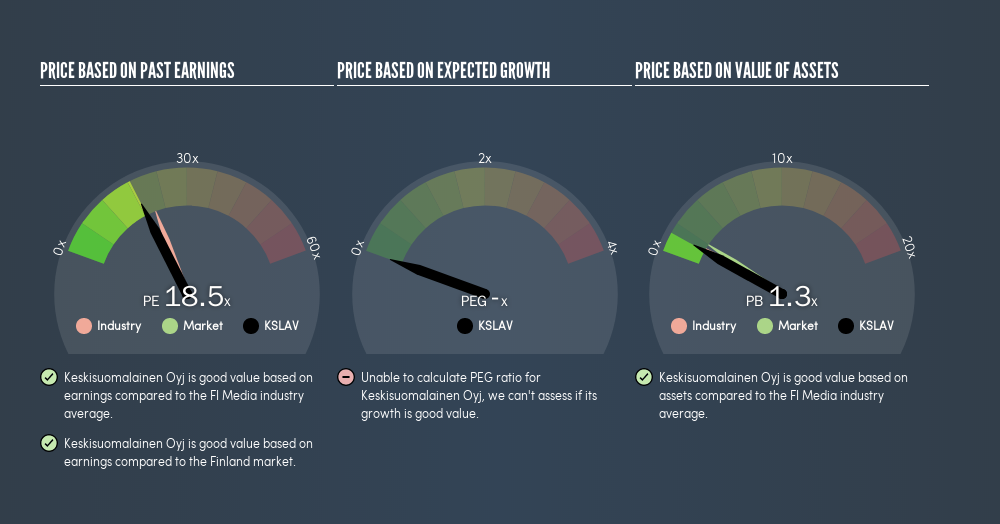
This suggests that market participants think Keskisuomalainen Oyj will underperform other companies in its industry.
How Growth Rates Impact P/E Ratios
When earnings fall, the 'E' decreases, over time. That means even if the current P/E is low, it will increase over time if the share price stays flat. So while a stock may look cheap based on past earnings, it could be expensive based on future earnings.
Keskisuomalainen Oyj's earnings per share fell by 62% in the last twelve months. But over the longer term (5 years) earnings per share have increased by 3.6%. And EPS is down 10.0% a year, over the last 3 years. This growth rate might warrant a low P/E ratio.
A Limitation: P/E Ratios Ignore Debt and Cash In The Bank
Don't forget that the P/E ratio considers market capitalization. So it won't reflect the advantage of cash, or disadvantage of debt. The exact same company would hypothetically deserve a higher P/E ratio if it had a strong balance sheet, than if it had a weak one with lots of debt, because a cashed up company can spend on growth.
Such spending might be good or bad, overall, but the key point here is that you need to look at debt to understand the P/E ratio in context.
Keskisuomalainen Oyj's Balance Sheet
Keskisuomalainen Oyj has net debt equal to 38% of its market cap. While it's worth keeping this in mind, it isn't a worry.
The Verdict On Keskisuomalainen Oyj's P/E Ratio
Keskisuomalainen Oyj trades on a P/E ratio of 18.5, which is fairly close to the FI market average of 19. Given it has some debt, but didn't grow last year, the P/E indicates the market is expecting higher profits ahead for the business.
When the market is wrong about a stock, it gives savvy investors an opportunity. As value investor Benjamin Graham famously said, 'In the short run, the market is a voting machine but in the long run, it is a weighing machine.' We don't have analyst forecasts, but shareholders might want to examine this detailed historical graph of earnings, revenue and cash flow.
Of course, you might find a fantastic investment by looking at a few good candidates. So take a peek at this free list of companies with modest (or no) debt, trading on a P/E below 20.
We aim to bring you long-term focused research analysis driven by fundamental data. Note that our analysis may not factor in the latest price-sensitive company announcements or qualitative material.
If you spot an error that warrants correction, please contact the editor at editorial-team@simplywallst.com. This article by Simply Wall St is general in nature. It does not constitute a recommendation to buy or sell any stock, and does not take account of your objectives, or your financial situation. Simply Wall St has no position in the stocks mentioned. Thank you for reading.
About HLSE:KSL
Keskisuomalainen Oyj
Engages in publishing, printing, and distributing newspapers and magazines in Finland.
Undervalued slight.
Market Insights


Advertisement
Community Narratives
For the Emperor: Why Games Workshop Could Be a Star Investment
Fair Value UK£160.00|0.5% overvalued
RO
Community Contributor
Securitas will boost margins with AI and tech-driven services
Fair Value SEK 260.91|44.9% undervalued
UN
Community Contributor
A Leader in EV Charging with Growth Potential
Fair Value €27.00|21.3% undervalued
TI
Community Contributor