
Advertisement
- Finland
- /
- Consumer Durables
- /
- HLSE:FSKRS
Why Fiskars Oyj Abp's (HEL:FSKRS) High P/E Ratio Isn't Necessarily A Bad Thing
The goal of this article is to teach you how to use price to earnings ratios (P/E ratios). We'll apply a basic P/E ratio analysis to Fiskars Oyj Abp's (HEL:FSKRS), to help you decide if the stock is worth further research. What is Fiskars Oyj Abp's P/E ratio? Well, based on the last twelve months it is 20.02. That is equivalent to an earnings yield of about 5.0%.
Check out our latest analysis for Fiskars Oyj Abp
How Do I Calculate A Price To Earnings Ratio?
The formula for P/E is:
Price to Earnings Ratio = Share Price ÷ Earnings per Share (EPS)
Or for Fiskars Oyj Abp:
P/E of 20.02 = €20 ÷ €1.0 (Based on the year to December 2018.)
Is A High P/E Ratio Good?
The higher the P/E ratio, the higher the price tag of a business, relative to its trailing earnings. That isn't a good or a bad thing on its own, but a high P/E means that buyers have a higher opinion of the business's prospects, relative to stocks with a lower P/E.
How Growth Rates Impact P/E Ratios
When earnings fall, the 'E' decreases, over time. Therefore, even if you pay a low multiple of earnings now, that multiple will become higher in the future. So while a stock may look cheap based on past earnings, it could be expensive based on future earnings.
Fiskars Oyj Abp's earnings per share fell by 51% in the last twelve months. And over the longer term (5 years) earnings per share have decreased 2.7% annually. This might lead to muted expectations.
Does Fiskars Oyj Abp Have A Relatively High Or Low P/E For Its Industry?
The P/E ratio indicates whether the market has higher or lower expectations of a company. You can see in the image below that the average P/E (11.6) for companies in the consumer durables industry is lower than Fiskars Oyj Abp's P/E.
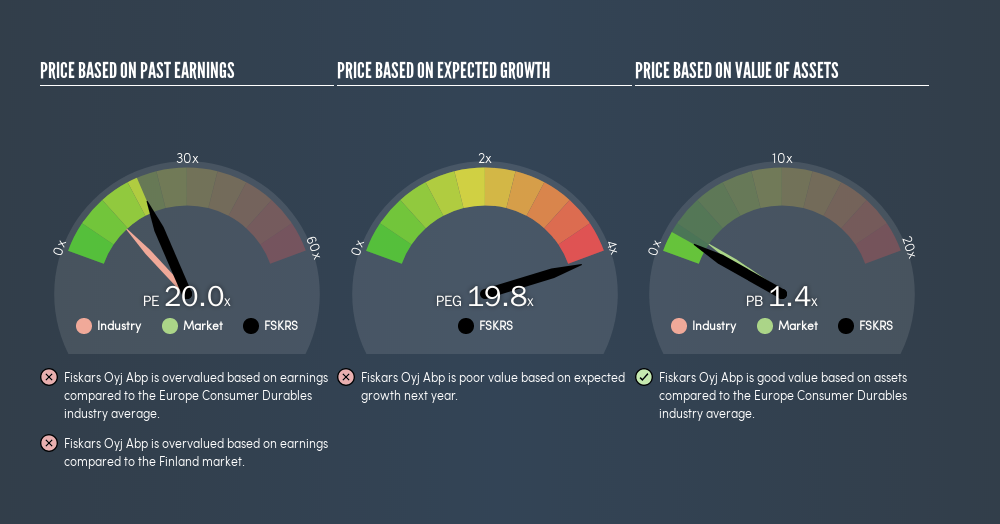
Its relatively high P/E ratio indicates that Fiskars Oyj Abp shareholders think it will perform better than other companies in its industry classification. The market is optimistic about the future, but that doesn't guarantee future growth. So investors should delve deeper. I like to check if company insiders have been buying or selling.
Don't Forget: The P/E Does Not Account For Debt or Bank Deposits
Don't forget that the P/E ratio considers market capitalization. Thus, the metric does not reflect cash or debt held by the company. In theory, a company can lower its future P/E ratio by using cash or debt to invest in growth.
While growth expenditure doesn't always pay off, the point is that it is a good option to have; but one that the P/E ratio ignores.
Is Debt Impacting Fiskars Oyj Abp's P/E?
With net cash of €317m, Fiskars Oyj Abp has a very strong balance sheet, which may be important for its business. Having said that, at 19% of its market capitalization the cash hoard would contribute towards a higher P/E ratio.
The Verdict On Fiskars Oyj Abp's P/E Ratio
Fiskars Oyj Abp has a P/E of 20. That's around the same as the average in the FI market, which is 19.8. While the absence of growth in the last year is probably causing a degree of pessimism, the healthy balance sheet means the company retains potential for future growth. So it's not surprising to see it trade on a P/E roughly in line with the market.
Investors have an opportunity when market expectations about a stock are wrong. If the reality for a company is better than it expects, you can make money by buying and holding for the long term. So this freevisual report on analyst forecasts could hold the key to an excellent investment decision.
But note: Fiskars Oyj Abp may not be the best stock to buy. So take a peek at this freelist of interesting companies with strong recent earnings growth (and a P/E ratio below 20).
We aim to bring you long-term focused research analysis driven by fundamental data. Note that our analysis may not factor in the latest price-sensitive company announcements or qualitative material.
If you spot an error that warrants correction, please contact the editor at editorial-team@simplywallst.com. This article by Simply Wall St is general in nature. It does not constitute a recommendation to buy or sell any stock, and does not take account of your objectives, or your financial situation. Simply Wall St has no position in the stocks mentioned. Thank you for reading.
About HLSE:FSKRS
Fiskars Oyj Abp
Manufactures and markets consumer products for indoor and outdoor living in Europe, the Americas, and the Asia Pacific.
Moderate growth potential with mediocre balance sheet.
Similar Companies
Market Insights


Advertisement
Community Narratives
The Future of Drug Testing? Fingerprint Tech Shows Serious Promise
Fair Value US$2.98|40.3% undervalued
JO
Community Contributor
Suncorp’s Next Chapter: Insurance-Only and Ready to Grow
Fair Value AU$22.83|7.9% undervalued
RO
Community Contributor
Thyssenkrupp Nucera Will Achieve Double-Digit Profits by 2030 Boosted by Hydrogen Growth
Fair Value €14.40|31.6% undervalued
CH
Community Contributor
Tesla’s Nvidia Moment – The AI & Robotics Inflection Point
Fair Value US$359.72|12.3% undervalued
BL
Community Contributor