

Key Insights
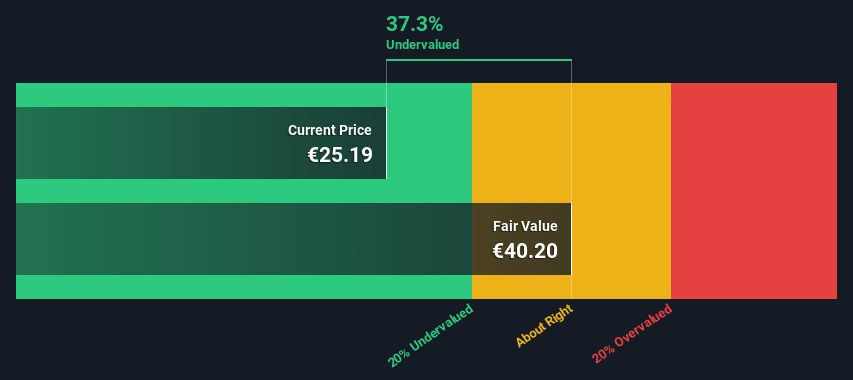
- The projected fair value for Valmet Oyj is €40.20 based on 2 Stage Free Cash Flow to Equity
- Valmet Oyj's €25.19 share price signals that it might be 37% undervalued
- Analyst price target for VALMT is €27.70 which is 31% below our fair value estimate
In this article we are going to estimate the intrinsic value of Valmet Oyj (HEL:VALMT) by estimating the company's future cash flows and discounting them to their present value. The Discounted Cash Flow (DCF) model is the tool we will apply to do this. Don't get put off by the jargon, the math behind it is actually quite straightforward.
We generally believe that a company's value is the present value of all of the cash it will generate in the future. However, a DCF is just one valuation metric among many, and it is not without flaws. Anyone interested in learning a bit more about intrinsic value should have a read of the Simply Wall St analysis model.
View our latest analysis for Valmet Oyj
Crunching The Numbers
We use what is known as a 2-stage model, which simply means we have two different periods of growth rates for the company's cash flows. Generally the first stage is higher growth, and the second stage is a lower growth phase. In the first stage we need to estimate the cash flows to the business over the next ten years. Where possible we use analyst estimates, but when these aren't available we extrapolate the previous free cash flow (FCF) from the last estimate or reported value. We assume companies with shrinking free cash flow will slow their rate of shrinkage, and that companies with growing free cash flow will see their growth rate slow, over this period. We do this to reflect that growth tends to slow more in the early years than it does in later years.
A DCF is all about the idea that a dollar in the future is less valuable than a dollar today, so we discount the value of these future cash flows to their estimated value in today's dollars:
10-year free cash flow (FCF) forecast
| 2024 | 2025 | 2026 | 2027 | 2028 | 2029 | 2030 | 2031 | 2032 | 2033 | |
| Levered FCF (€, Millions) | €395.6m | €422.6m | €518.0m | €508.0m | €505.0m | €504.3m | €505.0m | €506.7m | €509.1m | €512.1m |
| Growth Rate Estimate Source | Analyst x5 | Analyst x5 | Analyst x1 | Analyst x1 | Analyst x1 | Est @ -0.14% | Est @ 0.14% | Est @ 0.34% | Est @ 0.48% | Est @ 0.57% |
| Present Value (€, Millions) Discounted @ 7.2% | €369 | €368 | €421 | €385 | €357 | €333 | €311 | €291 | €273 | €256 |
("Est" = FCF growth rate estimated by Simply Wall St)
Present Value of 10-year Cash Flow (PVCF) = €3.4b
After calculating the present value of future cash flows in the initial 10-year period, we need to calculate the Terminal Value, which accounts for all future cash flows beyond the first stage. The Gordon Growth formula is used to calculate Terminal Value at a future annual growth rate equal to the 5-year average of the 10-year government bond yield of 0.8%. We discount the terminal cash flows to today's value at a cost of equity of 7.2%.
Terminal Value (TV)= FCF2033 × (1 + g) ÷ (r – g) = €512m× (1 + 0.8%) ÷ (7.2%– 0.8%) = €8.1b
Present Value of Terminal Value (PVTV)= TV / (1 + r)10= €8.1b÷ ( 1 + 7.2%)10= €4.0b
The total value is the sum of cash flows for the next ten years plus the discounted terminal value, which results in the Total Equity Value, which in this case is €7.4b. The last step is to then divide the equity value by the number of shares outstanding. Relative to the current share price of €25.2, the company appears quite good value at a 37% discount to where the stock price trades currently. Valuations are imprecise instruments though, rather like a telescope - move a few degrees and end up in a different galaxy. Do keep this in mind.
The Assumptions
Now the most important inputs to a discounted cash flow are the discount rate, and of course, the actual cash flows. You don't have to agree with these inputs, I recommend redoing the calculations yourself and playing with them. The DCF also does not consider the possible cyclicality of an industry, or a company's future capital requirements, so it does not give a full picture of a company's potential performance. Given that we are looking at Valmet Oyj as potential shareholders, the cost of equity is used as the discount rate, rather than the cost of capital (or weighted average cost of capital, WACC) which accounts for debt. In this calculation we've used 7.2%, which is based on a levered beta of 1.138. Beta is a measure of a stock's volatility, compared to the market as a whole. We get our beta from the industry average beta of globally comparable companies, with an imposed limit between 0.8 and 2.0, which is a reasonable range for a stable business.
SWOT Analysis for Valmet Oyj
- Earnings growth over the past year exceeded its 5-year average.
- Debt is not viewed as a risk.
- Earnings growth over the past year underperformed the Machinery industry.
- Dividend is low compared to the top 25% of dividend payers in the Machinery market.
- Annual earnings are forecast to grow for the next 3 years.
- Good value based on P/E ratio and estimated fair value.
- Dividends are not covered by cash flow.
- Annual earnings are forecast to grow slower than the Finnish market.
Looking Ahead:
Valuation is only one side of the coin in terms of building your investment thesis, and it shouldn't be the only metric you look at when researching a company. It's not possible to obtain a foolproof valuation with a DCF model. Rather it should be seen as a guide to "what assumptions need to be true for this stock to be under/overvalued?" If a company grows at a different rate, or if its cost of equity or risk free rate changes sharply, the output can look very different. Why is the intrinsic value higher than the current share price? For Valmet Oyj, we've compiled three fundamental aspects you should further research:
- Risks: Case in point, we've spotted 1 warning sign for Valmet Oyj you should be aware of.
- Future Earnings: How does VALMT's growth rate compare to its peers and the wider market? Dig deeper into the analyst consensus number for the upcoming years by interacting with our free analyst growth expectation chart.
- Other Solid Businesses: Low debt, high returns on equity and good past performance are fundamental to a strong business. Why not explore our interactive list of stocks with solid business fundamentals to see if there are other companies you may not have considered!
PS. Simply Wall St updates its DCF calculation for every Finnish stock every day, so if you want to find the intrinsic value of any other stock just search here.
New: Manage All Your Stock Portfolios in One Place
We've created the ultimate portfolio companion for stock investors, and it's free.
• Connect an unlimited number of Portfolios and see your total in one currency
• Be alerted to new Warning Signs or Risks via email or mobile
• Track the Fair Value of your stocks
Have feedback on this article? Concerned about the content? Get in touch with us directly. Alternatively, email editorial-team (at) simplywallst.com.
This article by Simply Wall St is general in nature. We provide commentary based on historical data and analyst forecasts only using an unbiased methodology and our articles are not intended to be financial advice. It does not constitute a recommendation to buy or sell any stock, and does not take account of your objectives, or your financial situation. We aim to bring you long-term focused analysis driven by fundamental data. Note that our analysis may not factor in the latest price-sensitive company announcements or qualitative material. Simply Wall St has no position in any stocks mentioned.
About HLSE:VALMT
Valmet Oyj
Develops and supplies process technologies, automation, and services for the pulp, paper, and energy industries in North America, South America, China, Europe, the Middle East, Africa, and the Asia Pacific.
Very undervalued with excellent balance sheet and pays a dividend.

