
David Iben put it well when he said, 'Volatility is not a risk we care about. What we care about is avoiding the permanent loss of capital.' When we think about how risky a company is, we always like to look at its use of debt, since debt overload can lead to ruin. We note that Vidrala, S.A. (BME:VID) does have debt on its balance sheet. But should shareholders be worried about its use of debt?
Why Does Debt Bring Risk?
Debt assists a business until the business has trouble paying it off, either with new capital or with free cash flow. If things get really bad, the lenders can take control of the business. However, a more usual (but still expensive) situation is where a company must dilute shareholders at a cheap share price simply to get debt under control. Of course, plenty of companies use debt to fund growth, without any negative consequences. When we think about a company's use of debt, we first look at cash and debt together.
Check out our latest analysis for Vidrala
How Much Debt Does Vidrala Carry?
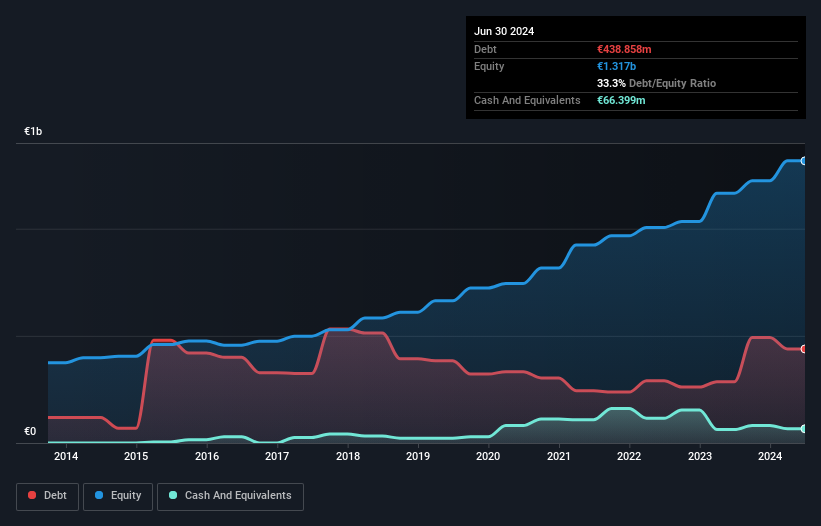
The image below, which you can click on for greater detail, shows that at June 2024 Vidrala had debt of €438.9m, up from €286.1m in one year. However, it does have €66.4m in cash offsetting this, leading to net debt of about €372.5m.
How Healthy Is Vidrala's Balance Sheet?
According to the last reported balance sheet, Vidrala had liabilities of €662.6m due within 12 months, and liabilities of €580.1m due beyond 12 months. Offsetting these obligations, it had cash of €66.4m as well as receivables valued at €450.6m due within 12 months. So it has liabilities totalling €725.8m more than its cash and near-term receivables, combined.
This deficit isn't so bad because Vidrala is worth €3.32b, and thus could probably raise enough capital to shore up its balance sheet, if the need arose. But we definitely want to keep our eyes open to indications that its debt is bringing too much risk.
We measure a company's debt load relative to its earnings power by looking at its net debt divided by its earnings before interest, tax, depreciation, and amortization (EBITDA) and by calculating how easily its earnings before interest and tax (EBIT) cover its interest expense (interest cover). This way, we consider both the absolute quantum of the debt, as well as the interest rates paid on it.
Vidrala has net debt of just 0.93 times EBITDA, indicating that it is certainly not a reckless borrower. And this view is supported by the solid interest coverage, with EBIT coming in at 9.7 times the interest expense over the last year. And we also note warmly that Vidrala grew its EBIT by 11% last year, making its debt load easier to handle. When analysing debt levels, the balance sheet is the obvious place to start. But ultimately the future profitability of the business will decide if Vidrala can strengthen its balance sheet over time. So if you're focused on the future you can check out this free report showing analyst profit forecasts.
But our final consideration is also important, because a company cannot pay debt with paper profits; it needs cold hard cash. So the logical step is to look at the proportion of that EBIT that is matched by actual free cash flow. In the last three years, Vidrala's free cash flow amounted to 40% of its EBIT, less than we'd expect. That's not great, when it comes to paying down debt.
Our View
Vidrala's interest cover suggests it can handle its debt as easily as Cristiano Ronaldo could score a goal against an under 14's goalkeeper. And that's just the beginning of the good news since its net debt to EBITDA is also very heartening. Looking at all the aforementioned factors together, it strikes us that Vidrala can handle its debt fairly comfortably. Of course, while this leverage can enhance returns on equity, it does bring more risk, so it's worth keeping an eye on this one. Above most other metrics, we think its important to track how fast earnings per share is growing, if at all. If you've also come to that realization, you're in luck, because today you can view this interactive graph of Vidrala's earnings per share history for free.
Of course, if you're the type of investor who prefers buying stocks without the burden of debt, then don't hesitate to discover our exclusive list of net cash growth stocks, today.
If you're looking to trade Vidrala, open an account with the lowest-cost platform trusted by professionals, Interactive Brokers.
With clients in over 200 countries and territories, and access to 160 markets, IBKR lets you trade stocks, options, futures, forex, bonds and funds from a single integrated account.
Enjoy no hidden fees, no account minimums, and FX conversion rates as low as 0.03%, far better than what most brokers offer.
Sponsored ContentNew: Manage All Your Stock Portfolios in One Place
We've created the ultimate portfolio companion for stock investors, and it's free.
• Connect an unlimited number of Portfolios and see your total in one currency
• Be alerted to new Warning Signs or Risks via email or mobile
• Track the Fair Value of your stocks
Have feedback on this article? Concerned about the content? Get in touch with us directly. Alternatively, email editorial-team (at) simplywallst.com.
This article by Simply Wall St is general in nature. We provide commentary based on historical data and analyst forecasts only using an unbiased methodology and our articles are not intended to be financial advice. It does not constitute a recommendation to buy or sell any stock, and does not take account of your objectives, or your financial situation. We aim to bring you long-term focused analysis driven by fundamental data. Note that our analysis may not factor in the latest price-sensitive company announcements or qualitative material. Simply Wall St has no position in any stocks mentioned.
About BME:VID
Vidrala
Manufactures and sells glass containers for food and beverage products in the United Kingdom, Ireland, Italy, Iberian Peninsula, rest of Europe, and Brazil.
Flawless balance sheet with proven track record and pays a dividend.
Market Insights

Community Narratives

