
Advertisement
Is Vidrala, S.A.'s (BME:VID) Latest Stock Performance Being Led By Its Strong Fundamentals?

Vidrala's (BME:VID) stock is up by 2.1% over the past three months. Given that the market rewards strong financials in the long-term, we wonder if that is the case in this instance. Particularly, we will be paying attention to Vidrala's ROE today.
Return on equity or ROE is a key measure used to assess how efficiently a company's management is utilizing the company's capital. In simpler terms, it measures the profitability of a company in relation to shareholder's equity.
Check out our latest analysis for Vidrala
How To Calculate Return On Equity?
The formula for ROE is:
Return on Equity = Net Profit (from continuing operations) ÷ Shareholders' Equity
So, based on the above formula, the ROE for Vidrala is:
18% = €238m ÷ €1.3b (Based on the trailing twelve months to December 2024).
The 'return' is the profit over the last twelve months. One way to conceptualize this is that for each €1 of shareholders' capital it has, the company made €0.18 in profit.
What Is The Relationship Between ROE And Earnings Growth?
Thus far, we have learned that ROE measures how efficiently a company is generating its profits. Depending on how much of these profits the company reinvests or "retains", and how effectively it does so, we are then able to assess a company’s earnings growth potential. Assuming everything else remains unchanged, the higher the ROE and profit retention, the higher the growth rate of a company compared to companies that don't necessarily bear these characteristics.
Vidrala's Earnings Growth And 18% ROE
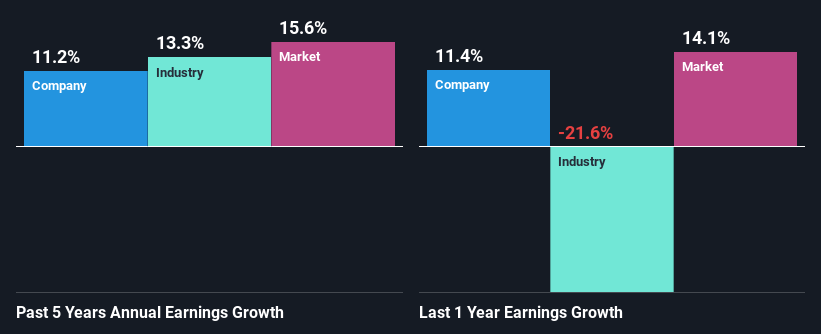
To begin with, Vidrala seems to have a respectable ROE. On comparing with the average industry ROE of 9.2% the company's ROE looks pretty remarkable. This certainly adds some context to Vidrala's decent 11% net income growth seen over the past five years.
As a next step, we compared Vidrala's net income growth with the industry and found that the company has a similar growth figure when compared with the industry average growth rate of 13% in the same period.
The basis for attaching value to a company is, to a great extent, tied to its earnings growth. The investor should try to establish if the expected growth or decline in earnings, whichever the case may be, is priced in. Doing so will help them establish if the stock's future looks promising or ominous. Is VID fairly valued? This infographic on the company's intrinsic value has everything you need to know.
Is Vidrala Efficiently Re-investing Its Profits?
Vidrala's three-year median payout ratio to shareholders is 22% (implying that it retains 78% of its income), which is on the lower side, so it seems like the management is reinvesting profits heavily to grow its business.
Besides, Vidrala has been paying dividends for at least ten years or more. This shows that the company is committed to sharing profits with its shareholders. Our latest analyst data shows that the future payout ratio of the company over the next three years is expected to be approximately 23%. Therefore, the company's future ROE is also not expected to change by much with analysts predicting an ROE of 15%.
Summary
On the whole, we feel that Vidrala's performance has been quite good. In particular, it's great to see that the company is investing heavily into its business and along with a high rate of return, that has resulted in a sizeable growth in its earnings. With that said, the latest industry analyst forecasts reveal that the company's earnings growth is expected to slow down. To know more about the latest analysts predictions for the company, check out this visualization of analyst forecasts for the company.
New: Manage All Your Stock Portfolios in One Place
We've created the ultimate portfolio companion for stock investors, and it's free.
• Connect an unlimited number of Portfolios and see your total in one currency
• Be alerted to new Warning Signs or Risks via email or mobile
• Track the Fair Value of your stocks
Have feedback on this article? Concerned about the content? Get in touch with us directly. Alternatively, email editorial-team (at) simplywallst.com.
This article by Simply Wall St is general in nature. We provide commentary based on historical data and analyst forecasts only using an unbiased methodology and our articles are not intended to be financial advice. It does not constitute a recommendation to buy or sell any stock, and does not take account of your objectives, or your financial situation. We aim to bring you long-term focused analysis driven by fundamental data. Note that our analysis may not factor in the latest price-sensitive company announcements or qualitative material. Simply Wall St has no position in any stocks mentioned.
About BME:VID
Vidrala
Manufactures and sells glass containers for food and beverage products in the United Kingdom, Ireland, Italy, Iberian Peninsula, rest of Europe, and Brazil.
Flawless balance sheet with proven track record and pays a dividend.
Market Insights

Advertisement
Community Narratives
WhiteCap Is Positioned To Profit Regardless Of Trump's Policy 
Fair Value CA$22.60|61.6% undervalued
ST
Equity Analyst and Writer
Microsoft's Evolution Will Drive Revenue to New Heights Fueled by AI
Fair Value US$360.00|28.3% overvalued
BR
Community Contributor
A CASE FOR USD$2.50 (CAD$3.44) BY 2028 (A 5-10 BAGGER)
Fair Value CA$3.44|87.8% undervalued
AG
Community Contributor