- Spain
- /
- Construction
- /
- BME:ENO
Despite lower earnings than three years ago, Elecnor (BME:ENO) investors are up 106% since then


By buying an index fund, investors can approximate the average market return. But if you buy good businesses at attractive prices, your portfolio returns could exceed the average market return. Just take a look at Elecnor, S.A. (BME:ENO), which is up 92%, over three years, soundly beating the market return of 27% (not including dividends). On the other hand, the returns haven't been quite so good recently, with shareholders up just 31%, including dividends.
While this past week has detracted from the company's three-year return, let's look at the recent trends of the underlying business and see if the gains have been in alignment.
View our latest analysis for Elecnor
To quote Buffett, 'Ships will sail around the world but the Flat Earth Society will flourish. There will continue to be wide discrepancies between price and value in the marketplace...' By comparing earnings per share (EPS) and share price changes over time, we can get a feel for how investor attitudes to a company have morphed over time.
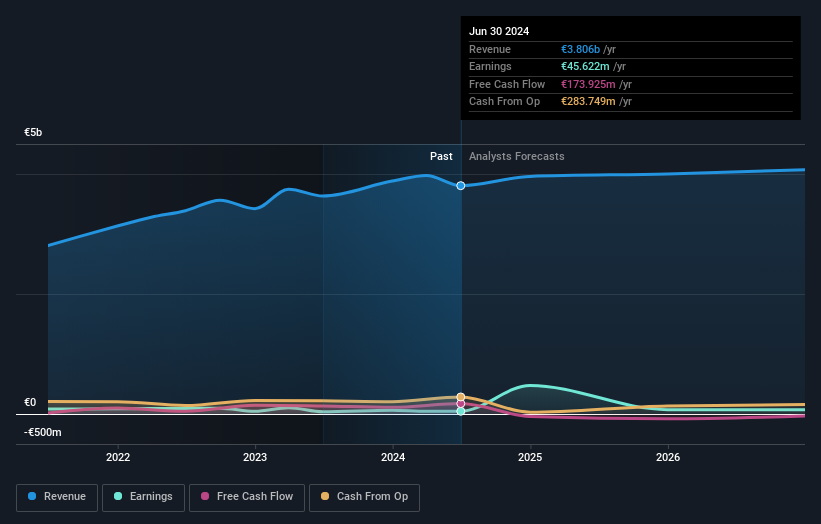
During the three years of share price growth, Elecnor actually saw its earnings per share (EPS) drop 18% per year.
This means it's unlikely the market is judging the company based on earnings growth. Given this situation, it makes sense to look at other metrics too.
It could be that the revenue growth of 10% per year is viewed as evidence that Elecnor is growing. In that case, the company may be sacrificing current earnings per share to drive growth, and maybe shareholder's faith in better days ahead will be rewarded.
The image below shows how earnings and revenue have tracked over time (if you click on the image you can see greater detail).
We know that Elecnor has improved its bottom line lately, but what does the future have in store? If you are thinking of buying or selling Elecnor stock, you should check out this free report showing analyst profit forecasts.
What About Dividends?
When looking at investment returns, it is important to consider the difference between total shareholder return (TSR) and share price return. The TSR is a return calculation that accounts for the value of cash dividends (assuming that any dividend received was reinvested) and the calculated value of any discounted capital raisings and spin-offs. So for companies that pay a generous dividend, the TSR is often a lot higher than the share price return. In the case of Elecnor, it has a TSR of 106% for the last 3 years. That exceeds its share price return that we previously mentioned. And there's no prize for guessing that the dividend payments largely explain the divergence!
A Different Perspective
Elecnor shareholders have received returns of 31% over twelve months (even including dividends), which isn't far from the general market return. Most would be happy with a gain, and it helps that the year's return is actually better than the average return over five years, which was 16%. Even if the share price growth slows down from here, there's a good chance that this is business worth watching in the long term. While it is well worth considering the different impacts that market conditions can have on the share price, there are other factors that are even more important. Case in point: We've spotted 1 warning sign for Elecnor you should be aware of.
Of course, you might find a fantastic investment by looking elsewhere. So take a peek at this free list of companies we expect will grow earnings.
Please note, the market returns quoted in this article reflect the market weighted average returns of stocks that currently trade on Spanish exchanges.
Valuation is complex, but we're here to simplify it.
Discover if Elecnor might be undervalued or overvalued with our detailed analysis, featuring fair value estimates, potential risks, dividends, insider trades, and its financial condition.
Access Free AnalysisHave feedback on this article? Concerned about the content? Get in touch with us directly. Alternatively, email editorial-team (at) simplywallst.com.
This article by Simply Wall St is general in nature. We provide commentary based on historical data and analyst forecasts only using an unbiased methodology and our articles are not intended to be financial advice. It does not constitute a recommendation to buy or sell any stock, and does not take account of your objectives, or your financial situation. We aim to bring you long-term focused analysis driven by fundamental data. Note that our analysis may not factor in the latest price-sensitive company announcements or qualitative material. Simply Wall St has no position in any stocks mentioned.
About BME:ENO
Elecnor
Engages in the development, construction, and operation of projects and services in Spain and internationally.
Flawless balance sheet average dividend payer.
Similar Companies
Market Insights

Community Narratives


