
Advertisement
- Spain
- /
- Electrical
- /
- BME:EIDF
With A 25% Price Drop For Energía, Innovación y Desarrollo Fotovoltaico, S.A. (BME:EIDF) You'll Still Get What You Pay For

Energía, Innovación y Desarrollo Fotovoltaico, S.A. (BME:EIDF) shares have had a horrible month, losing 25% after a relatively good period beforehand. The recent drop completes a disastrous twelve months for shareholders, who are sitting on a 82% loss during that time.
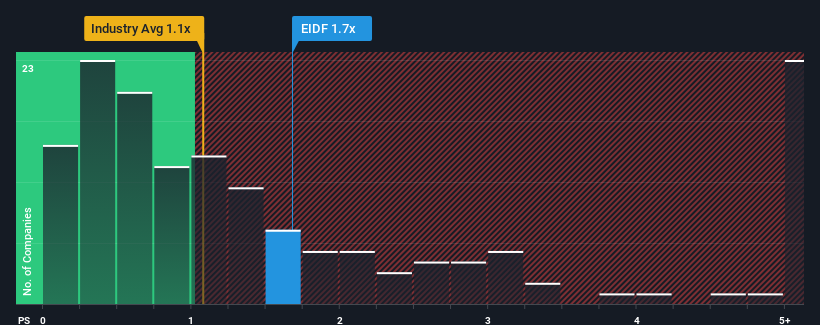
In spite of the heavy fall in price, you could still be forgiven for thinking Energía Innovación y Desarrollo Fotovoltaico is a stock not worth researching with a price-to-sales ratios (or "P/S") of 1.7x, considering almost half the companies in Spain's Electrical industry have P/S ratios below 1.1x. Although, it's not wise to just take the P/S at face value as there may be an explanation why it's as high as it is.
View our latest analysis for Energía Innovación y Desarrollo Fotovoltaico
What Does Energía Innovación y Desarrollo Fotovoltaico's Recent Performance Look Like?
For instance, Energía Innovación y Desarrollo Fotovoltaico's receding revenue in recent times would have to be some food for thought. One possibility is that the P/S is high because investors think the company will still do enough to outperform the broader industry in the near future. If not, then existing shareholders may be quite nervous about the viability of the share price.
Although there are no analyst estimates available for Energía Innovación y Desarrollo Fotovoltaico, take a look at this free data-rich visualisation to see how the company stacks up on earnings, revenue and cash flow.Do Revenue Forecasts Match The High P/S Ratio?
The only time you'd be truly comfortable seeing a P/S as high as Energía Innovación y Desarrollo Fotovoltaico's is when the company's growth is on track to outshine the industry.
Retrospectively, the last year delivered a frustrating 37% decrease to the company's top line. In spite of this, the company still managed to deliver immense revenue growth over the last three years. Therefore, it's fair to say the revenue growth recently has been superb for the company, but investors will want to ask why it is now in decline.
Comparing that to the industry, which is only predicted to deliver 10.0% growth in the next 12 months, the company's momentum is stronger based on recent medium-term annualised revenue results.
With this information, we can see why Energía Innovación y Desarrollo Fotovoltaico is trading at such a high P/S compared to the industry. It seems most investors are expecting this strong growth to continue and are willing to pay more for the stock.
The Key Takeaway
Despite the recent share price weakness, Energía Innovación y Desarrollo Fotovoltaico's P/S remains higher than most other companies in the industry. While the price-to-sales ratio shouldn't be the defining factor in whether you buy a stock or not, it's quite a capable barometer of revenue expectations.
It's no surprise that Energía Innovación y Desarrollo Fotovoltaico can support its high P/S given the strong revenue growth its experienced over the last three-year is superior to the current industry outlook. Right now shareholders are comfortable with the P/S as they are quite confident revenue aren't under threat. Unless the recent medium-term conditions change, they will continue to provide strong support to the share price.
There are also other vital risk factors to consider and we've discovered 4 warning signs for Energía Innovación y Desarrollo Fotovoltaico (3 are concerning!) that you should be aware of before investing here.
If strong companies turning a profit tickle your fancy, then you'll want to check out this free list of interesting companies that trade on a low P/E (but have proven they can grow earnings).
Valuation is complex, but we're here to simplify it.
Discover if Energía Innovación y Desarrollo Fotovoltaico might be undervalued or overvalued with our detailed analysis, featuring fair value estimates, potential risks, dividends, insider trades, and its financial condition.
Access Free AnalysisHave feedback on this article? Concerned about the content? Get in touch with us directly. Alternatively, email editorial-team (at) simplywallst.com.
This article by Simply Wall St is general in nature. We provide commentary based on historical data and analyst forecasts only using an unbiased methodology and our articles are not intended to be financial advice. It does not constitute a recommendation to buy or sell any stock, and does not take account of your objectives, or your financial situation. We aim to bring you long-term focused analysis driven by fundamental data. Note that our analysis may not factor in the latest price-sensitive company announcements or qualitative material. Simply Wall St has no position in any stocks mentioned.
Have feedback on this article? Concerned about the content? Get in touch with us directly. Alternatively, email editorial-team@simplywallst.com
About BME:EIDF
Energía Innovación y Desarrollo Fotovoltaico
Energía, Innovación y Desarrollo Fotovoltaico, S.A.
Slight with imperfect balance sheet.
Similar Companies
Market Insights

Advertisement
Community Narratives
Groundbreaking therapies that could change the treatment landscape for PTSD, fibromyalgia, MS & Alzheimer’s
Fair Value US$6.20|86.9% undervalued
CM
Community Contributor
DigitalOcean Will Grow 14% by Embracing AI with Paperspace Acquisition
Fair Value US$50.00|41.7% undervalued
NE
Community Contributor
Viant Technology: A Rising AdTech Challenger in the AI-Powered CTV Market
Fair Value US$38.61|63.2% undervalued
BL
Community Contributor
Volvo will Accelerate Forward into Electric and Autonomous Leadership in Five Years
Fair Value SEK 438.80|39.7% undervalued
UN
Community Contributor