Advertisement
- Denmark
- /
- Renewable Energy
- /
- CPSE:ORSTED
Should You Reconsider Ørsted After Recent Project Cancellations and Share Price Fall in 2025?

Simply Wall St
Reviewed by Bailey Pemberton
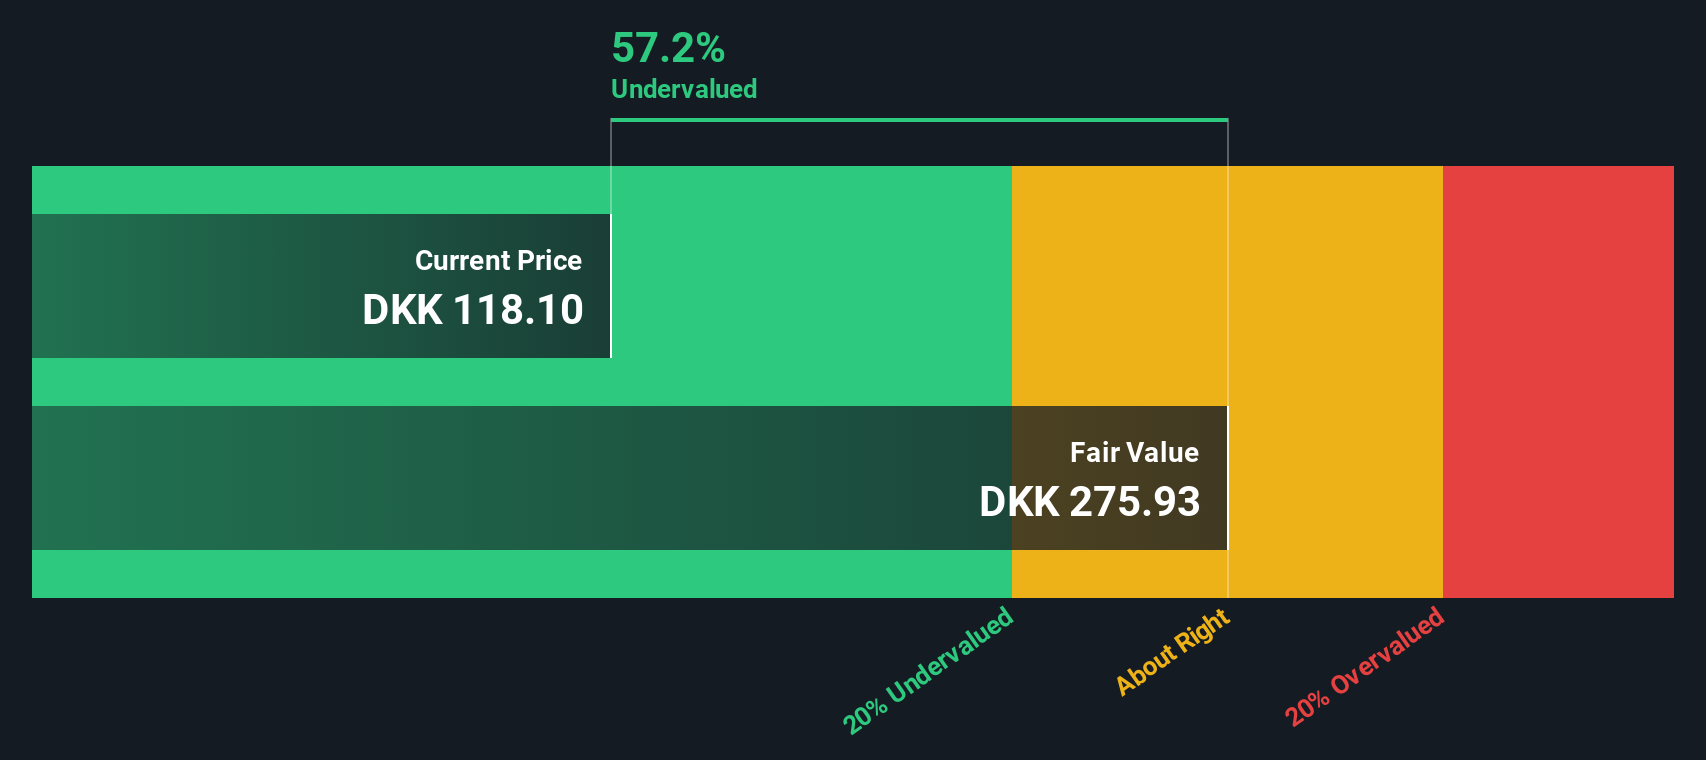
- Wondering if Ørsted's recent turbulence means the stock is a hidden bargain or a value trap? You're not alone, and the story behind the numbers is surprisingly layered.
- After years of struggles, Ørsted’s stock has rebounded 5.4% over the past week and 2.7% in the last 30 days, yet it is still down a striking 63.1% year-to-date and 43.3% over the past year.
- Recent headlines have centered around Ørsted’s abrupt project cancellations and the company’s ongoing efforts to stabilize its offshore wind business. Both developments have fueled investor uncertainty. Policy changes in key markets and ongoing inflationary pressures have also added new twists to the company’s pricing outlook.
- Right now, Ørsted scores just 2 out of 6 on our standard undervaluation checks. However, as we will see, different valuation approaches can tell very different stories, and there is an even smarter way to cut through the noise, which we will explore by the end of this article.
Ørsted scores just 2/6 on our valuation checks. See what other red flags we found in the full valuation breakdown.
Approach 1: Ørsted Dividend Discount Model (DDM) Analysis
The Dividend Discount Model (DDM) is designed to estimate a stock’s intrinsic value by projecting future dividends and discounting them back to today’s value. This approach works best for companies with predictable and sustainable dividend growth. For Ørsted, the DDM uses recent dividend per share figures along with future growth assumptions to build its valuation case.
According to the model, Ørsted paid dividends per share of DKK 3.18, but the payout ratio sits at a staggering 984.6%. This means Ørsted is paying out nearly ten times as much in dividends as it is earning, raising serious questions about the sustainability of current dividend levels. The model applies a conservative long-term growth rate of 1.71%, capped based on the company's fundamentals.
Based on these projections, DDM estimates Ørsted’s fair value at DKK 64.99 per share. With the current market price far higher, the intrinsic discount implied by the DDM suggests the stock is 90.7% overvalued. This strong overvaluation signal comes largely from concerns that current dividends are not sustainable unless underlying earnings improve dramatically.
Result: OVERVALUED
Our Dividend Discount Model (DDM) analysis suggests Ørsted may be overvalued by 90.7%. Discover 879 undervalued stocks or create your own screener to find better value opportunities.
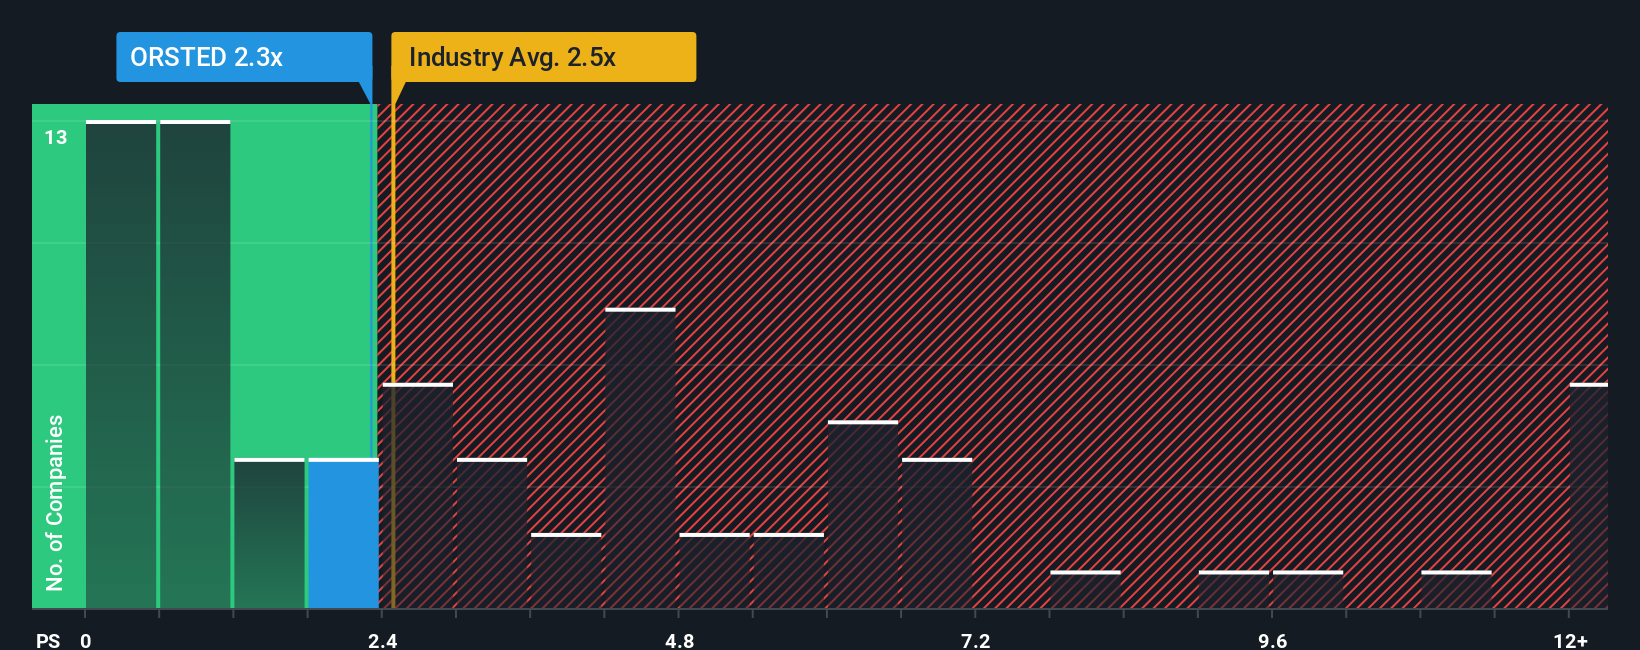
Approach 2: Ørsted Price vs Sales
The Price-to-Sales (P/S) ratio is a popular valuation metric for companies in industries like renewable energy, especially when earnings are negative or highly volatile. It allows investors to compare how much they are paying for each unit of revenue the company generates. This makes the metric especially useful for fast-growing or turnaround businesses that might not be posting profits yet.
What makes a "normal" or "fair" P/S ratio can depend on several factors such as expected revenue growth, risk levels, and overall profitability. Higher expected growth and lower risk typically justify a higher multiple, while uncertainty and weaker outlooks tend to pull it lower.
Currently, Ørsted trades at a P/S ratio of 2.3x. For comparison, the average among its renewable energy industry peers is slightly higher at 2.31x, and the peer group average is 3.55x. On face value, Ørsted appears fairly valued or even slightly cheap relative to some competitors.
However, Simply Wall St’s “Fair Ratio” model refines this analysis by assigning a multiple tailored to Ørsted’s unique mix of growth, profitability, risks, and market cap. Instead of a single industry benchmark, the Fair Ratio aims to reflect what a rational investor would be willing to pay for this specific business given its actual prospects and challenges.
Comparing the Fair Ratio to Ørsted’s actual P/S multiple, the difference is very slight, suggesting the stock is priced about right based on its fundamentals and risk profile.
Result: ABOUT RIGHT
PS ratios tell one story, but what if the real opportunity lies elsewhere? Discover 1405 companies where insiders are betting big on explosive growth.
Upgrade Your Decision Making: Choose your Ørsted Narrative
Earlier we mentioned there's an even better way to understand valuation, so let's introduce you to Narratives. A Narrative is your personal story about a company. It is how you connect your perspective on Ørsted’s prospects with the numbers, such as your own estimates of fair value, future revenue, and profit margins.
Narratives go beyond static models by tying Ørsted’s business outlook directly to a forward-looking financial forecast and a calculated fair value, all backed by your assumptions. This means each investor can quickly see how the story they believe in translates into a clear buy or sell recommendation, simply by comparing fair value with today’s market price.
Best of all, Narratives are simple to use and accessible on Simply Wall St’s Community page, where millions of investors share and update their views. They are also dynamic, automatically updating when Ørsted releases fresh news or earnings, so your analysis stays relevant and informed.
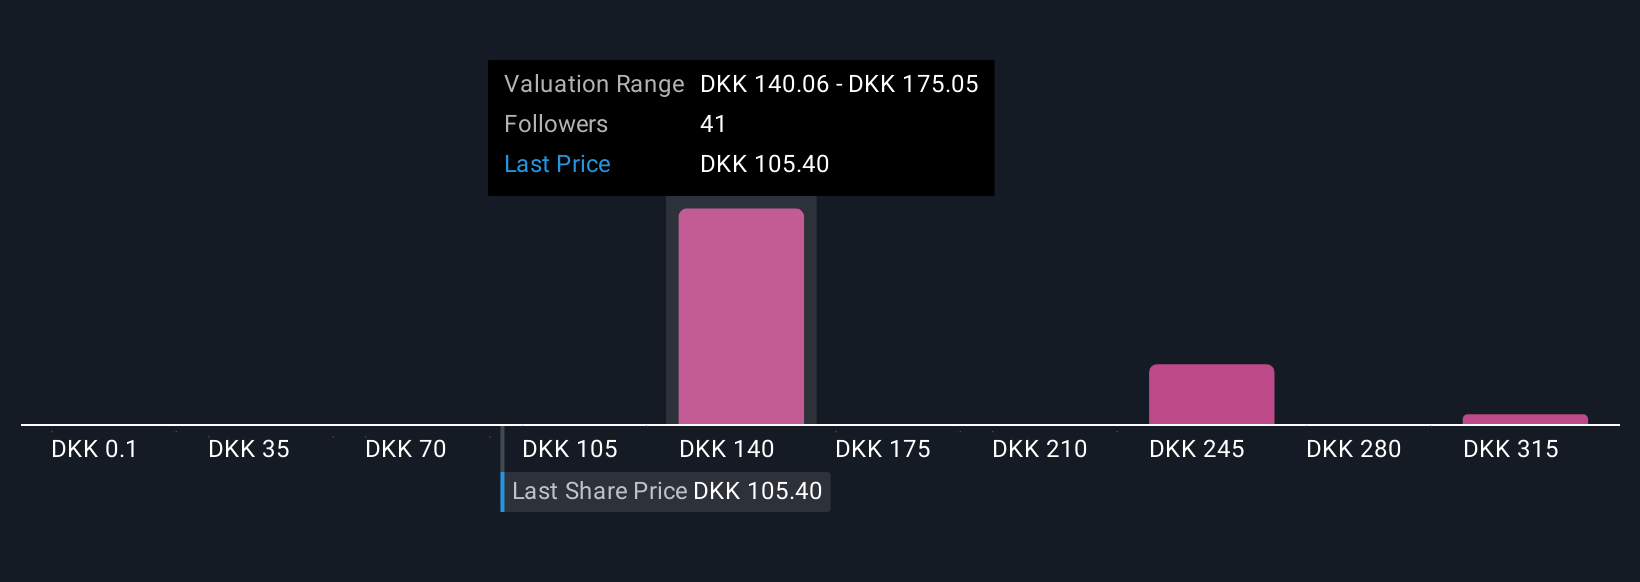
For example, on Ørsted, one investor’s Narrative might predict a rapid recovery with a much higher fair value, while another forecasts more challenges ahead and a much lower value. This gives you a spectrum of real-time, data-driven opinions to guide your next move.
Do you think there's more to the story for Ørsted? Head over to our Community to see what others are saying!
This article by Simply Wall St is general in nature. We provide commentary based on historical data and analyst forecasts only using an unbiased methodology and our articles are not intended to be financial advice. It does not constitute a recommendation to buy or sell any stock, and does not take account of your objectives, or your financial situation. We aim to bring you long-term focused analysis driven by fundamental data. Note that our analysis may not factor in the latest price-sensitive company announcements or qualitative material. Simply Wall St has no position in any stocks mentioned.
Valuation is complex, but we're here to simplify it.
Discover if Ørsted might be undervalued or overvalued with our detailed analysis, featuring fair value estimates, potential risks, dividends, insider trades, and its financial condition.
Access Free AnalysisHave feedback on this article? Concerned about the content? Get in touch with us directly. Alternatively, email editorial-team@simplywallst.com
About CPSE:ORSTED
Ørsted
Owns, develops, constructs, and operates offshore and onshore wind farms, solar farms, energy storage and renewable hydrogen facilities, and bioenergy plants.
Reasonable growth potential with low risk.
Similar Companies
Market Insights

Advertisement
Community Narratives
MINISO's fair value is projected at 26.69 with an anticipated PE ratio shift of 20x
Fair Value US$24.03|11.0% undervalued
BE
Community Contributor
Procter & Gamble: A Dividend Giant Facing Slowing Growth
Fair Value US$119.81|23.3% overvalued
AN
Community Contributor
Eli Lilly's Future Growth Driven by Tirzepatide and Favorable Market Conditions
Fair Value US$1.19k|13.8% undervalued
EA
Community Contributor