- Denmark
- /
- Electronic Equipment and Components
- /
- CPSE:QINTER
Q-Interline Full Year 2022 Earnings: kr.131 loss per share (vs kr.0.21 loss in FY 2021)


Q-Interline (CPH:QINTER) Full Year 2022 Results
Key Financial Results
- Revenue: kr.28.8m (flat on FY 2021).
- Net loss: kr.2.00m (flat on FY 2021).
- kr.131 loss per share (further deteriorated from kr.0.21 loss in FY 2021).
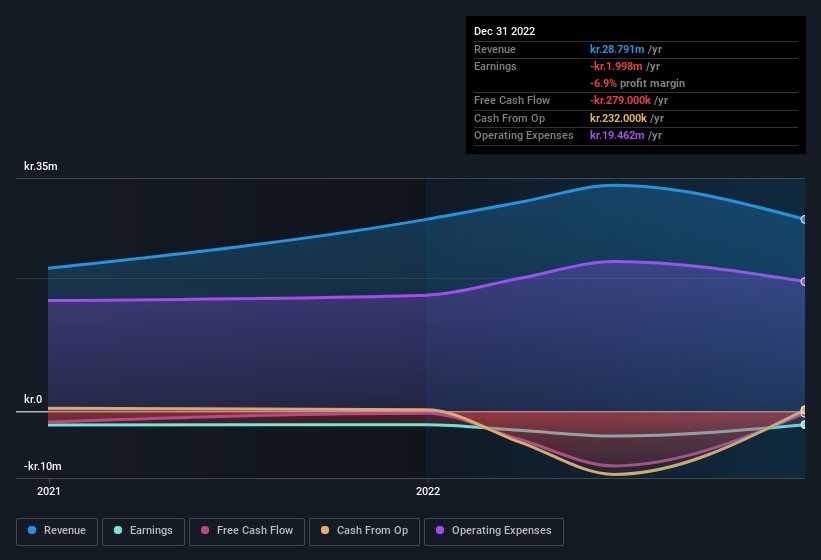
All figures shown in the chart above are for the trailing 12 month (TTM) period
Q-Interline shares are down 2.5% from a week ago.
Risk Analysis
What about risks? Every company has them, and we've spotted 4 warning signs for Q-Interline (of which 2 are a bit concerning!) you should know about.
If you're looking to trade Q-Interline, open an account with the lowest-cost platform trusted by professionals, Interactive Brokers.
With clients in over 200 countries and territories, and access to 160 markets, IBKR lets you trade stocks, options, futures, forex, bonds and funds from a single integrated account.
Enjoy no hidden fees, no account minimums, and FX conversion rates as low as 0.03%, far better than what most brokers offer.
Sponsored ContentValuation is complex, but we're here to simplify it.
Discover if Q-Interline might be undervalued or overvalued with our detailed analysis, featuring fair value estimates, potential risks, dividends, insider trades, and its financial condition.
Access Free AnalysisHave feedback on this article? Concerned about the content? Get in touch with us directly. Alternatively, email editorial-team (at) simplywallst.com.
This article by Simply Wall St is general in nature. We provide commentary based on historical data and analyst forecasts only using an unbiased methodology and our articles are not intended to be financial advice. It does not constitute a recommendation to buy or sell any stock, and does not take account of your objectives, or your financial situation. We aim to bring you long-term focused analysis driven by fundamental data. Note that our analysis may not factor in the latest price-sensitive company announcements or qualitative material. Simply Wall St has no position in any stocks mentioned.
About CPSE:QINTER
Q-Interline
Develops and manufactures analytical solutions and measuring equipment for process and product quality optimization in Denmark.
Moderate with adequate balance sheet.
Market Insights

Community Narratives

