Some Investors May Be Worried About Netcompany Group's (CPH:NETC) Returns On Capital

There are a few key trends to look for if we want to identify the next multi-bagger. In a perfect world, we'd like to see a company investing more capital into its business and ideally the returns earned from that capital are also increasing. This shows us that it's a compounding machine, able to continually reinvest its earnings back into the business and generate higher returns. Having said that, from a first glance at Netcompany Group (CPH:NETC) we aren't jumping out of our chairs at how returns are trending, but let's have a deeper look.
Return On Capital Employed (ROCE): What Is It?
For those who don't know, ROCE is a measure of a company's yearly pre-tax profit (its return), relative to the capital employed in the business. The formula for this calculation on Netcompany Group is:
Return on Capital Employed = Earnings Before Interest and Tax (EBIT) ÷ (Total Assets - Current Liabilities)
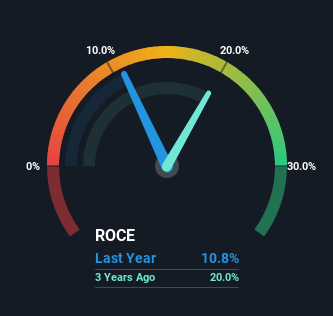
0.11 = kr.669m ÷ (kr.8.2b - kr.2.0b) (Based on the trailing twelve months to June 2024).
So, Netcompany Group has an ROCE of 11%. By itself that's a normal return on capital and it's in line with the industry's average returns of 11%.
View our latest analysis for Netcompany Group
In the above chart we have measured Netcompany Group's prior ROCE against its prior performance, but the future is arguably more important. If you're interested, you can view the analysts predictions in our free analyst report for Netcompany Group .
What Does the ROCE Trend For Netcompany Group Tell Us?
In terms of Netcompany Group's historical ROCE movements, the trend isn't fantastic. Over the last five years, returns on capital have decreased to 11% from 14% five years ago. On the other hand, the company has been employing more capital without a corresponding improvement in sales in the last year, which could suggest these investments are longer term plays. It's worth keeping an eye on the company's earnings from here on to see if these investments do end up contributing to the bottom line.
While on the subject, we noticed that the ratio of current liabilities to total assets has risen to 25%, which has impacted the ROCE. Without this increase, it's likely that ROCE would be even lower than 11%. While the ratio isn't currently too high, it's worth keeping an eye on this because if it gets particularly high, the business could then face some new elements of risk.
The Bottom Line
In summary, Netcompany Group is reinvesting funds back into the business for growth but unfortunately it looks like sales haven't increased much just yet. And with the stock having returned a mere 21% in the last five years to shareholders, you could argue that they're aware of these lackluster trends. Therefore, if you're looking for a multi-bagger, we'd propose looking at other options.
If you'd like to know about the risks facing Netcompany Group, we've discovered 1 warning sign that you should be aware of.
If you want to search for solid companies with great earnings, check out this free list of companies with good balance sheets and impressive returns on equity.
The New Payments ETF Is Live on NASDAQ:
Money is moving to real-time rails, and a newly listed ETF now gives investors direct exposure. Fast settlement. Institutional custody. Simple access.
Explore how this launch could reshape portfolios
Sponsored ContentValuation is complex, but we're here to simplify it.
Discover if Netcompany Group might be undervalued or overvalued with our detailed analysis, featuring fair value estimates, potential risks, dividends, insider trades, and its financial condition.
Access Free AnalysisHave feedback on this article? Concerned about the content? Get in touch with us directly. Alternatively, email editorial-team (at) simplywallst.com.
This article by Simply Wall St is general in nature. We provide commentary based on historical data and analyst forecasts only using an unbiased methodology and our articles are not intended to be financial advice. It does not constitute a recommendation to buy or sell any stock, and does not take account of your objectives, or your financial situation. We aim to bring you long-term focused analysis driven by fundamental data. Note that our analysis may not factor in the latest price-sensitive company announcements or qualitative material. Simply Wall St has no position in any stocks mentioned.
About CPSE:NETC
Netcompany Group
Provides business critical IT solutions to private and public customers in Denmark, Norway, the United Kingdom, the Netherlands, Greece, Belgium, Luxembourg, and internationally.
High growth potential with adequate balance sheet.
Similar Companies
Market Insights

Weekly Picks

Early mover in a fast growing industry. Likely to experience share price volatility as they scale


A case for CA$31.80 (undiluted), aka 8,616% upside from CA$0.37 (an 86 bagger!).


Moderation and Stabilisation: HOLD: Fair Price based on a 4-year Cycle is $12.08
Recently Updated Narratives

Airbnb Stock: Platform Growth in a World of Saturation and Scrutiny

Clarivate Stock: When Data Becomes the Backbone of Innovation and Law

Adobe Stock: AI-Fueled ARR Growth Pushes Guidance Higher, But Cost Pressures Loom
Popular Narratives


Crazy Undervalued 42 Baggers Silver Play (Active & Running Mine)


NVDA: Expanding AI Demand Will Drive Major Data Center Investments Through 2026


MicroVision will explode future revenue by 380.37% with a vision towards success
Trending Discussion
