

Key Insights
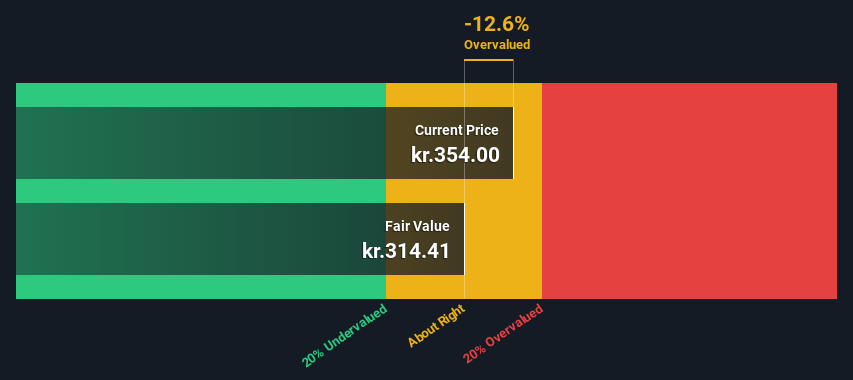
- The projected fair value for Novozymes is kr.314 based on 2 Stage Free Cash Flow to Equity
- With kr.354 share price, Novozymes appears to be trading close to its estimated fair value
- Our fair value estimate is 21% lower than Novozymes' analyst price target of kr.396
Does the May share price for Novozymes A/S (CPH:NZYM B) reflect what it's really worth? Today, we will estimate the stock's intrinsic value by taking the expected future cash flows and discounting them to their present value. One way to achieve this is by employing the Discounted Cash Flow (DCF) model. There's really not all that much to it, even though it might appear quite complex.
Companies can be valued in a lot of ways, so we would point out that a DCF is not perfect for every situation. If you still have some burning questions about this type of valuation, take a look at the Simply Wall St analysis model.
Check out our latest analysis for Novozymes
The Method
We are going to use a two-stage DCF model, which, as the name states, takes into account two stages of growth. The first stage is generally a higher growth period which levels off heading towards the terminal value, captured in the second 'steady growth' period. In the first stage we need to estimate the cash flows to the business over the next ten years. Where possible we use analyst estimates, but when these aren't available we extrapolate the previous free cash flow (FCF) from the last estimate or reported value. We assume companies with shrinking free cash flow will slow their rate of shrinkage, and that companies with growing free cash flow will see their growth rate slow, over this period. We do this to reflect that growth tends to slow more in the early years than it does in later years.
Generally we assume that a dollar today is more valuable than a dollar in the future, so we discount the value of these future cash flows to their estimated value in today's dollars:
10-year free cash flow (FCF) forecast
| 2023 | 2024 | 2025 | 2026 | 2027 | 2028 | 2029 | 2030 | 2031 | 2032 | |
| Levered FCF (DKK, Millions) | kr.2.19b | kr.3.62b | kr.3.85b | kr.4.61b | kr.4.90b | kr.5.10b | kr.5.25b | kr.5.37b | kr.5.46b | kr.5.52b |
| Growth Rate Estimate Source | Analyst x10 | Analyst x10 | Analyst x8 | Analyst x2 | Analyst x2 | Est @ 4.09% | Est @ 2.96% | Est @ 2.17% | Est @ 1.61% | Est @ 1.23% |
| Present Value (DKK, Millions) Discounted @ 6.0% | kr.2.1k | kr.3.2k | kr.3.2k | kr.3.6k | kr.3.7k | kr.3.6k | kr.3.5k | kr.3.4k | kr.3.2k | kr.3.1k |
("Est" = FCF growth rate estimated by Simply Wall St)
Present Value of 10-year Cash Flow (PVCF) = kr.33b
After calculating the present value of future cash flows in the initial 10-year period, we need to calculate the Terminal Value, which accounts for all future cash flows beyond the first stage. For a number of reasons a very conservative growth rate is used that cannot exceed that of a country's GDP growth. In this case we have used the 5-year average of the 10-year government bond yield (0.3%) to estimate future growth. In the same way as with the 10-year 'growth' period, we discount future cash flows to today's value, using a cost of equity of 6.0%.
Terminal Value (TV)= FCF2032 × (1 + g) ÷ (r – g) = kr.5.5b× (1 + 0.3%) ÷ (6.0%– 0.3%) = kr.97b
Present Value of Terminal Value (PVTV)= TV / (1 + r)10= kr.97b÷ ( 1 + 6.0%)10= kr.54b
The total value, or equity value, is then the sum of the present value of the future cash flows, which in this case is kr.87b. In the final step we divide the equity value by the number of shares outstanding. Relative to the current share price of kr.354, the company appears around fair value at the time of writing. The assumptions in any calculation have a big impact on the valuation, so it is better to view this as a rough estimate, not precise down to the last cent.
The Assumptions
The calculation above is very dependent on two assumptions. The first is the discount rate and the other is the cash flows. You don't have to agree with these inputs, I recommend redoing the calculations yourself and playing with them. The DCF also does not consider the possible cyclicality of an industry, or a company's future capital requirements, so it does not give a full picture of a company's potential performance. Given that we are looking at Novozymes as potential shareholders, the cost of equity is used as the discount rate, rather than the cost of capital (or weighted average cost of capital, WACC) which accounts for debt. In this calculation we've used 6.0%, which is based on a levered beta of 0.957. Beta is a measure of a stock's volatility, compared to the market as a whole. We get our beta from the industry average beta of globally comparable companies, with an imposed limit between 0.8 and 2.0, which is a reasonable range for a stable business.
SWOT Analysis for Novozymes
- Earnings growth over the past year exceeded the industry.
- Debt is well covered by earnings and cashflows.
- Dividend is low compared to the top 25% of dividend payers in the Chemicals market.
- Expensive based on P/E ratio and estimated fair value.
- Annual earnings are forecast to grow faster than the Danish market.
- Significant insider buying over the past 3 months.
- Dividends are not covered by cash flow.
- Annual revenue is forecast to grow slower than the Danish market.
Next Steps:
Valuation is only one side of the coin in terms of building your investment thesis, and it is only one of many factors that you need to assess for a company. It's not possible to obtain a foolproof valuation with a DCF model. Instead the best use for a DCF model is to test certain assumptions and theories to see if they would lead to the company being undervalued or overvalued. For example, changes in the company's cost of equity or the risk free rate can significantly impact the valuation. For Novozymes, there are three fundamental elements you should consider:
- Risks: Every company has them, and we've spotted 2 warning signs for Novozymes you should know about.
- Future Earnings: How does NZYM B's growth rate compare to its peers and the wider market? Dig deeper into the analyst consensus number for the upcoming years by interacting with our free analyst growth expectation chart.
- Other High Quality Alternatives: Do you like a good all-rounder? Explore our interactive list of high quality stocks to get an idea of what else is out there you may be missing!
PS. Simply Wall St updates its DCF calculation for every Danish stock every day, so if you want to find the intrinsic value of any other stock just search here.
If you're looking to trade Novonesis, open an account with the lowest-cost platform trusted by professionals, Interactive Brokers.
With clients in over 200 countries and territories, and access to 160 markets, IBKR lets you trade stocks, options, futures, forex, bonds and funds from a single integrated account.
Enjoy no hidden fees, no account minimums, and FX conversion rates as low as 0.03%, far better than what most brokers offer.
Sponsored ContentValuation is complex, but we're here to simplify it.
Discover if Novonesis might be undervalued or overvalued with our detailed analysis, featuring fair value estimates, potential risks, dividends, insider trades, and its financial condition.
Access Free AnalysisHave feedback on this article? Concerned about the content? Get in touch with us directly. Alternatively, email editorial-team (at) simplywallst.com.
This article by Simply Wall St is general in nature. We provide commentary based on historical data and analyst forecasts only using an unbiased methodology and our articles are not intended to be financial advice. It does not constitute a recommendation to buy or sell any stock, and does not take account of your objectives, or your financial situation. We aim to bring you long-term focused analysis driven by fundamental data. Note that our analysis may not factor in the latest price-sensitive company announcements or qualitative material. Simply Wall St has no position in any stocks mentioned.
About CPSE:NSIS B
Novonesis
Produces and sells produces various industrial enzymes, functional proteins, and microorganisms in Denmark, rest of Europe, North America, Asia Pacific, the Middle East, Africa, Latin America, and internationally.
Excellent balance sheet with moderate growth potential.
Similar Companies
Market Insights

Community Narratives

