Is Flügger group A/S' (CPH:FLUG B) Recent Stock Performance Influenced By Its Fundamentals In Any Way?

Most readers would already be aware that Flügger group's (CPH:FLUG B) stock increased significantly by 61% over the past three months. Given that stock prices are usually aligned with a company's financial performance in the long-term, we decided to study its financial indicators more closely to see if they had a hand to play in the recent price move. Specifically, we decided to study Flügger group's ROE in this article.
Return on equity or ROE is a key measure used to assess how efficiently a company's management is utilizing the company's capital. Simply put, it is used to assess the profitability of a company in relation to its equity capital.
See our latest analysis for Flügger group
How Is ROE Calculated?
ROE can be calculated by using the formula:
Return on Equity = Net Profit (from continuing operations) ÷ Shareholders' Equity
So, based on the above formula, the ROE for Flügger group is:
12% = kr.108m ÷ kr.895m (Based on the trailing twelve months to July 2020).
The 'return' is the amount earned after tax over the last twelve months. That means that for every DKK1 worth of shareholders' equity, the company generated DKK0.12 in profit.
What Has ROE Got To Do With Earnings Growth?
We have already established that ROE serves as an efficient profit-generating gauge for a company's future earnings. We now need to evaluate how much profit the company reinvests or "retains" for future growth which then gives us an idea about the growth potential of the company. Assuming all else is equal, companies that have both a higher return on equity and higher profit retention are usually the ones that have a higher growth rate when compared to companies that don't have the same features.
A Side By Side comparison of Flügger group's Earnings Growth And 12% ROE
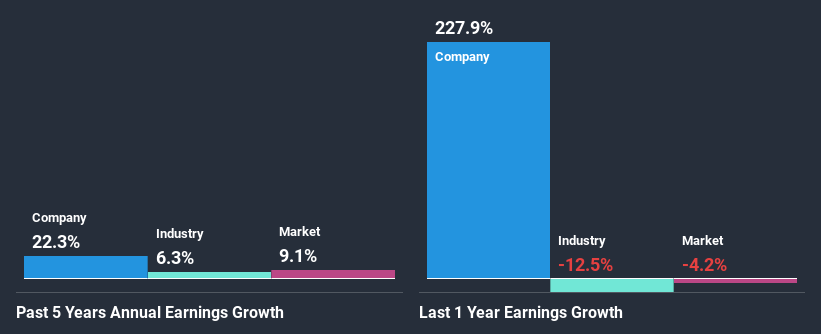
At first glance, Flügger group seems to have a decent ROE. Further, the company's ROE compares quite favorably to the industry average of 9.7%. Probably as a result of this, Flügger group was able to see an impressive net income growth of 22% over the last five years. However, there could also be other causes behind this growth. Such as - high earnings retention or an efficient management in place.
As a next step, we compared Flügger group's net income growth with the industry, and pleasingly, we found that the growth seen by the company is higher than the average industry growth of 8.7%.
Earnings growth is an important metric to consider when valuing a stock. What investors need to determine next is if the expected earnings growth, or the lack of it, is already built into the share price. Doing so will help them establish if the stock's future looks promising or ominous. One good indicator of expected earnings growth is the P/E ratio which determines the price the market is willing to pay for a stock based on its earnings prospects. So, you may want to check if Flügger group is trading on a high P/E or a low P/E, relative to its industry.
Is Flügger group Making Efficient Use Of Its Profits?
Flügger group has very a high three-year median payout ratio of 103% suggesting that the company's shareholders are getting paid from more than just the company's earnings. In spite of this, the company was able to grow its earnings significantly, as we saw above. Although, it could be worth keeping an eye on the high payout ratio as that's a huge risk. You can see the 2 risks we have identified for Flügger group by visiting our risks dashboard for free on our platform here.
Besides, Flügger group has been paying dividends for at least ten years or more. This shows that the company is committed to sharing profits with its shareholders.
Summary
On the whole, we do feel that Flügger group has some positive attributes. Especially the growth in earnings which was backed by an impressive ROE. Still, the high ROE could have been even more beneficial to investors had the company been reinvesting more of its profits. As highlighted earlier, the current reinvestment rate appears to be negligible. Until now, we have only just grazed the surface of the company's past performance by looking at the company's fundamentals. You can do your own research on Flügger group and see how it has performed in the past by looking at this FREE detailed graph of past earnings, revenue and cash flows.
If you’re looking to trade Flügger group, open an account with the lowest-cost* platform trusted by professionals, Interactive Brokers. Their clients from over 200 countries and territories trade stocks, options, futures, forex, bonds and funds worldwide from a single integrated account. Promoted
The New Payments ETF Is Live on NASDAQ:
Money is moving to real-time rails, and a newly listed ETF now gives investors direct exposure. Fast settlement. Institutional custody. Simple access.
Explore how this launch could reshape portfolios
Sponsored ContentNew: AI Stock Screener & Alerts
Our new AI Stock Screener scans the market every day to uncover opportunities.
• Dividend Powerhouses (3%+ Yield)
• Undervalued Small Caps with Insider Buying
• High growth Tech and AI Companies
Or build your own from over 50 metrics.
This article by Simply Wall St is general in nature. It does not constitute a recommendation to buy or sell any stock, and does not take account of your objectives, or your financial situation. We aim to bring you long-term focused analysis driven by fundamental data. Note that our analysis may not factor in the latest price-sensitive company announcements or qualitative material. Simply Wall St has no position in any stocks mentioned.
*Interactive Brokers Rated Lowest Cost Broker by StockBrokers.com Annual Online Review 2020
Have feedback on this article? Concerned about the content? Get in touch with us directly. Alternatively, email editorial-team@simplywallst.com.
About CPSE:FLUG B
Flügger group
Designs, manufactures, and markets decorative paints, wood protection products, spackling pastes, and wallpaper and tools.
Excellent balance sheet, good value and pays a dividend.
Market Insights

Weekly Picks

Early mover in a fast growing industry. Likely to experience share price volatility as they scale


A case for CA$31.80 (undiluted), aka 8,616% upside from CA$0.37 (an 86 bagger!).


Moderation and Stabilisation: HOLD: Fair Price based on a 4-year Cycle is $12.08
Recently Updated Narratives

Airbnb Stock: Platform Growth in a World of Saturation and Scrutiny

Adobe Stock: AI-Fueled ARR Growth Pushes Guidance Higher, But Cost Pressures Loom

Thomson Reuters Stock: When Legal Intelligence Becomes Mission-Critical Infrastructure
Popular Narratives


Crazy Undervalued 42 Baggers Silver Play (Active & Running Mine)


NVDA: Expanding AI Demand Will Drive Major Data Center Investments Through 2026

The AI Infrastructure Giant Grows Into Its Valuation
Trending Discussion


