
Advertisement
- Denmark
- /
- Healthtech
- /
- CPSE:NNIT
NNIT (CPH:NNIT shareholders incur further losses as stock declines 10% this week, taking five-year losses to 52%

We think intelligent long term investing is the way to go. But unfortunately, some companies simply don't succeed. To wit, the NNIT A/S (CPH:NNIT) share price managed to fall 56% over five long years. That's an unpleasant experience for long term holders. And the share price decline continued over the last week, dropping some 10%.
If the past week is anything to go by, investor sentiment for NNIT isn't positive, so let's see if there's a mismatch between fundamentals and the share price.
Check out our latest analysis for NNIT
To quote Buffett, 'Ships will sail around the world but the Flat Earth Society will flourish. There will continue to be wide discrepancies between price and value in the marketplace...' One flawed but reasonable way to assess how sentiment around a company has changed is to compare the earnings per share (EPS) with the share price.
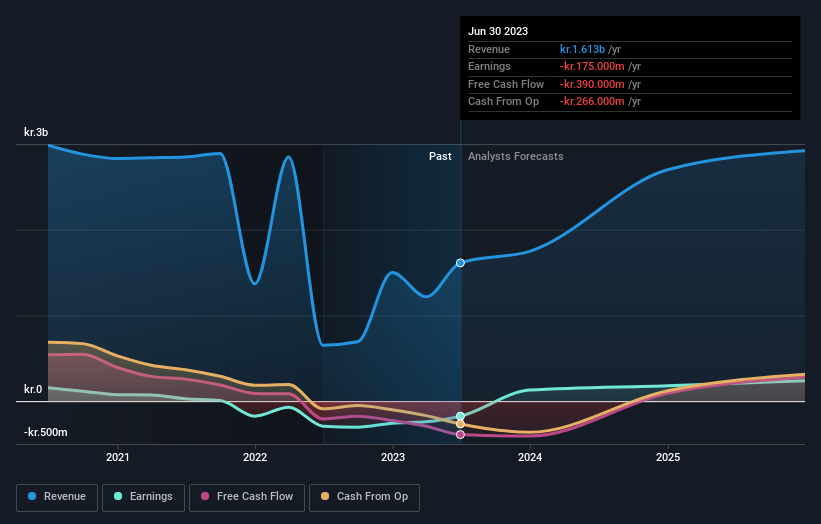
We know that NNIT has been profitable in the past. However, it made a loss in the last twelve months, suggesting profit may be an unreliable metric at this stage. Other metrics might give us a better handle on how its value is changing over time.
Arguably, the revenue drop of 17% a year for half a decade suggests that the company can't grow in the long term. That could explain the weak share price.
The image below shows how earnings and revenue have tracked over time (if you click on the image you can see greater detail).
You can see how its balance sheet has strengthened (or weakened) over time in this free interactive graphic.
What About The Total Shareholder Return (TSR)?
We'd be remiss not to mention the difference between NNIT's total shareholder return (TSR) and its share price return. The TSR is a return calculation that accounts for the value of cash dividends (assuming that any dividend received was reinvested) and the calculated value of any discounted capital raisings and spin-offs. Its history of dividend payouts mean that NNIT's TSR, which was a 52% drop over the last 5 years, was not as bad as the share price return.
A Different Perspective
It's good to see that NNIT has rewarded shareholders with a total shareholder return of 23% in the last twelve months. There's no doubt those recent returns are much better than the TSR loss of 9% per year over five years. The long term loss makes us cautious, but the short term TSR gain certainly hints at a brighter future. You might want to assess this data-rich visualization of its earnings, revenue and cash flow.
If you like to buy stocks alongside management, then you might just love this free list of companies. (Hint: insiders have been buying them).
Please note, the market returns quoted in this article reflect the market weighted average returns of stocks that currently trade on Danish exchanges.
Valuation is complex, but we're here to simplify it.
Discover if NNIT might be undervalued or overvalued with our detailed analysis, featuring fair value estimates, potential risks, dividends, insider trades, and its financial condition.
Access Free AnalysisHave feedback on this article? Concerned about the content? Get in touch with us directly. Alternatively, email editorial-team (at) simplywallst.com.
This article by Simply Wall St is general in nature. We provide commentary based on historical data and analyst forecasts only using an unbiased methodology and our articles are not intended to be financial advice. It does not constitute a recommendation to buy or sell any stock, and does not take account of your objectives, or your financial situation. We aim to bring you long-term focused analysis driven by fundamental data. Note that our analysis may not factor in the latest price-sensitive company announcements or qualitative material. Simply Wall St has no position in any stocks mentioned.
About CPSE:NNIT
NNIT
Provides information technology solutions for life sciences, public, and private sectors in Denmark, Europe, the United States, and Asia.
Good value with adequate balance sheet.
Similar Companies
Market Insights


Advertisement
Community Narratives
MicroStrategy: Volatile Gamble or Golden Opportunity?
Fair Value US$663.00|31.9% undervalued
BL
Community Contributor
Emerging Markets and Debt Reduction Will Propel Bath & Body Works Forward
Fair Value US$40.73|22.1% undervalued
ZW
Community Contributor
An amazing opportunity to potentially get a 100 bagger
Fair Value US$10.00|36.0% overvalued
DA
Community Contributor