Scandinavian Tobacco Group's (CPH:STG) earnings growth rate lags the 18% CAGR delivered to shareholders


Low-cost index funds make it easy to achieve average market returns. But if you invest in individual stocks, some are likely to underperform. Unfortunately for shareholders, while the Scandinavian Tobacco Group A/S (CPH:STG) share price is up 36% in the last three years, that falls short of the market return. Zooming in, the stock is actually down 15% in the last year.
Since the long term performance has been good but there's been a recent pullback of 4.7%, let's check if the fundamentals match the share price.
Check out our latest analysis for Scandinavian Tobacco Group
While the efficient markets hypothesis continues to be taught by some, it has been proven that markets are over-reactive dynamic systems, and investors are not always rational. By comparing earnings per share (EPS) and share price changes over time, we can get a feel for how investor attitudes to a company have morphed over time.
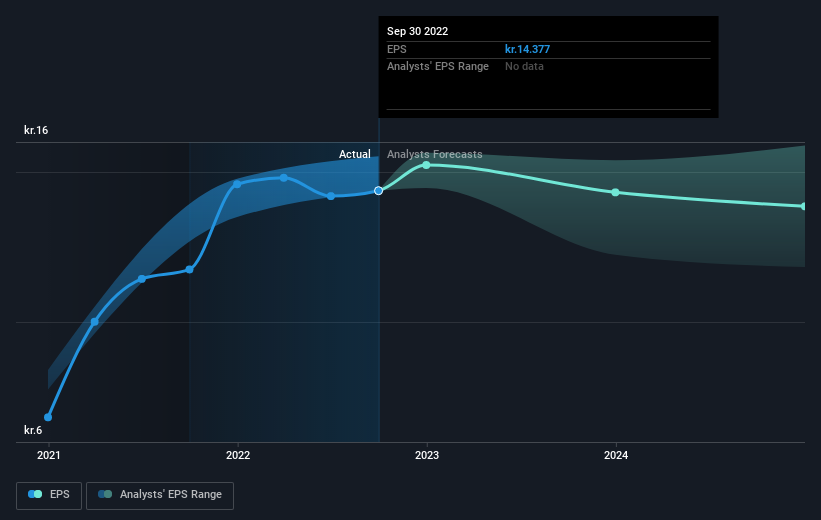
Scandinavian Tobacco Group was able to grow its EPS at 35% per year over three years, sending the share price higher. This EPS growth is higher than the 11% average annual increase in the share price. So it seems investors have become more cautious about the company, over time. This cautious sentiment is reflected in its (fairly low) P/E ratio of 7.65.
You can see below how EPS has changed over time (discover the exact values by clicking on the image).
It is of course excellent to see how Scandinavian Tobacco Group has grown profits over the years, but the future is more important for shareholders. It might be well worthwhile taking a look at our free report on how its financial position has changed over time.
What About Dividends?
When looking at investment returns, it is important to consider the difference between total shareholder return (TSR) and share price return. Whereas the share price return only reflects the change in the share price, the TSR includes the value of dividends (assuming they were reinvested) and the benefit of any discounted capital raising or spin-off. Arguably, the TSR gives a more comprehensive picture of the return generated by a stock. We note that for Scandinavian Tobacco Group the TSR over the last 3 years was 65%, which is better than the share price return mentioned above. The dividends paid by the company have thusly boosted the total shareholder return.
A Different Perspective
Scandinavian Tobacco Group shareholders are down 11% for the year (even including dividends), but the market itself is up 17%. Even the share prices of good stocks drop sometimes, but we want to see improvements in the fundamental metrics of a business, before getting too interested. Longer term investors wouldn't be so upset, since they would have made 7%, each year, over five years. It could be that the recent sell-off is an opportunity, so it may be worth checking the fundamental data for signs of a long term growth trend. While it is well worth considering the different impacts that market conditions can have on the share price, there are other factors that are even more important. Even so, be aware that Scandinavian Tobacco Group is showing 2 warning signs in our investment analysis , and 1 of those can't be ignored...
Of course, you might find a fantastic investment by looking elsewhere. So take a peek at this free list of companies we expect will grow earnings.
Please note, the market returns quoted in this article reflect the market weighted average returns of stocks that currently trade on DK exchanges.
If you're looking to trade Scandinavian Tobacco Group, open an account with the lowest-cost platform trusted by professionals, Interactive Brokers.
With clients in over 200 countries and territories, and access to 160 markets, IBKR lets you trade stocks, options, futures, forex, bonds and funds from a single integrated account.
Enjoy no hidden fees, no account minimums, and FX conversion rates as low as 0.03%, far better than what most brokers offer.
Sponsored ContentNew: Manage All Your Stock Portfolios in One Place
We've created the ultimate portfolio companion for stock investors, and it's free.
• Connect an unlimited number of Portfolios and see your total in one currency
• Be alerted to new Warning Signs or Risks via email or mobile
• Track the Fair Value of your stocks
Have feedback on this article? Concerned about the content? Get in touch with us directly. Alternatively, email editorial-team (at) simplywallst.com.
This article by Simply Wall St is general in nature. We provide commentary based on historical data and analyst forecasts only using an unbiased methodology and our articles are not intended to be financial advice. It does not constitute a recommendation to buy or sell any stock, and does not take account of your objectives, or your financial situation. We aim to bring you long-term focused analysis driven by fundamental data. Note that our analysis may not factor in the latest price-sensitive company announcements or qualitative material. Simply Wall St has no position in any stocks mentioned.
About CPSE:STG
Scandinavian Tobacco Group
Manufactures and sells tobacco products in North America, Europe, and internationally.
Undervalued with adequate balance sheet and pays a dividend.
Similar Companies
Market Insights

Community Narratives

