Stock Analysis
Investors in Pandora (CPH:PNDORA) have seen incredible returns of 425% over the past five years


For many, the main point of investing in the stock market is to achieve spectacular returns. While not every stock performs well, when investors win, they can win big. To wit, the Pandora A/S (CPH:PNDORA) share price has soared 348% over five years. This just goes to show the value creation that some businesses can achieve. In the last week shares have slid back 3.0%.
So let's investigate and see if the longer term performance of the company has been in line with the underlying business' progress.
See our latest analysis for Pandora
In his essay The Superinvestors of Graham-and-Doddsville Warren Buffett described how share prices do not always rationally reflect the value of a business. One flawed but reasonable way to assess how sentiment around a company has changed is to compare the earnings per share (EPS) with the share price.
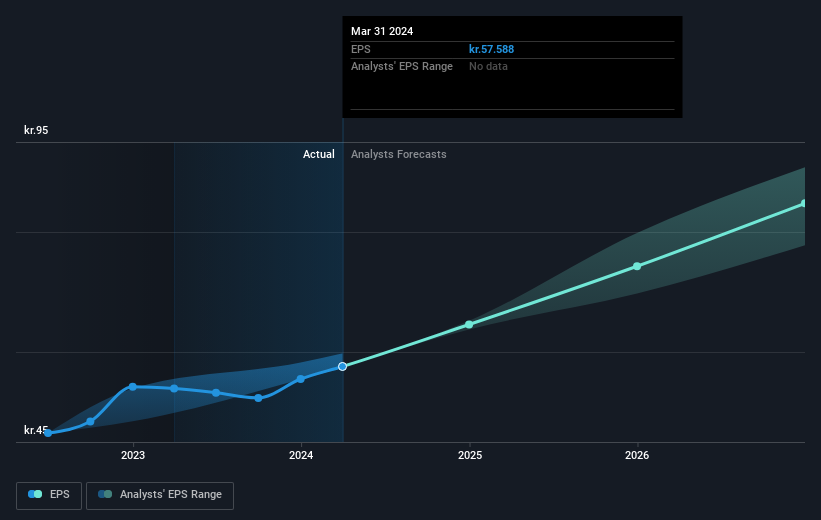
During five years of share price growth, Pandora achieved compound earnings per share (EPS) growth of 5.9% per year. This EPS growth is slower than the share price growth of 35% per year, over the same period. So it's fair to assume the market has a higher opinion of the business than it did five years ago. And that's hardly shocking given the track record of growth.
The company's earnings per share (over time) is depicted in the image below (click to see the exact numbers).
It is of course excellent to see how Pandora has grown profits over the years, but the future is more important for shareholders. Take a more thorough look at Pandora's financial health with this free report on its balance sheet.
What About Dividends?
It is important to consider the total shareholder return, as well as the share price return, for any given stock. The TSR is a return calculation that accounts for the value of cash dividends (assuming that any dividend received was reinvested) and the calculated value of any discounted capital raisings and spin-offs. It's fair to say that the TSR gives a more complete picture for stocks that pay a dividend. As it happens, Pandora's TSR for the last 5 years was 425%, which exceeds the share price return mentioned earlier. And there's no prize for guessing that the dividend payments largely explain the divergence!
A Different Perspective
It's good to see that Pandora has rewarded shareholders with a total shareholder return of 101% in the last twelve months. Of course, that includes the dividend. That gain is better than the annual TSR over five years, which is 39%. Therefore it seems like sentiment around the company has been positive lately. In the best case scenario, this may hint at some real business momentum, implying that now could be a great time to delve deeper. It's always interesting to track share price performance over the longer term. But to understand Pandora better, we need to consider many other factors. Take risks, for example - Pandora has 2 warning signs we think you should be aware of.
If you would prefer to check out another company -- one with potentially superior financials -- then do not miss this free list of companies that have proven they can grow earnings.
Please note, the market returns quoted in this article reflect the market weighted average returns of stocks that currently trade on Danish exchanges.
Valuation is complex, but we're helping make it simple.
Find out whether Pandora is potentially over or undervalued by checking out our comprehensive analysis, which includes fair value estimates, risks and warnings, dividends, insider transactions and financial health.
View the Free AnalysisHave feedback on this article? Concerned about the content? Get in touch with us directly. Alternatively, email editorial-team (at) simplywallst.com.
This article by Simply Wall St is general in nature. We provide commentary based on historical data and analyst forecasts only using an unbiased methodology and our articles are not intended to be financial advice. It does not constitute a recommendation to buy or sell any stock, and does not take account of your objectives, or your financial situation. We aim to bring you long-term focused analysis driven by fundamental data. Note that our analysis may not factor in the latest price-sensitive company announcements or qualitative material. Simply Wall St has no position in any stocks mentioned.
About CPSE:PNDORA
Pandora
Engages in the design, manufacture, and marketing of hand-finished and contemporary jewelry.
Good value average dividend payer.
