
Want to participate in a short research study? Help shape the future of investing tools and you could win a $250 gift card!
Today we are going to look at esoft systems A/S (CPH:ESOFT) to see whether it might be an attractive investment prospect. Specifically, we'll consider its Return On Capital Employed (ROCE), since that will give us an insight into how efficiently the business can generate profits from the capital it requires.
Firstly, we'll go over how we calculate ROCE. Next, we'll compare it to others in its industry. And finally, we'll look at how its current liabilities are impacting its ROCE.
Return On Capital Employed (ROCE): What is it?
ROCE is a metric for evaluating how much pre-tax income (in percentage terms) a company earns on the capital invested in its business. Generally speaking a higher ROCE is better. In brief, it is a useful tool, but it is not without drawbacks. Author Edwin Whiting says to be careful when comparing the ROCE of different businesses, since 'No two businesses are exactly alike.'
How Do You Calculate Return On Capital Employed?
The formula for calculating the return on capital employed is:
Return on Capital Employed = Earnings Before Interest and Tax (EBIT) ÷ (Total Assets - Current Liabilities)
Or for esoft systems:
0.0032 = ø148k ÷ (ø52m - ø5.4m) (Based on the trailing twelve months to December 2018.)
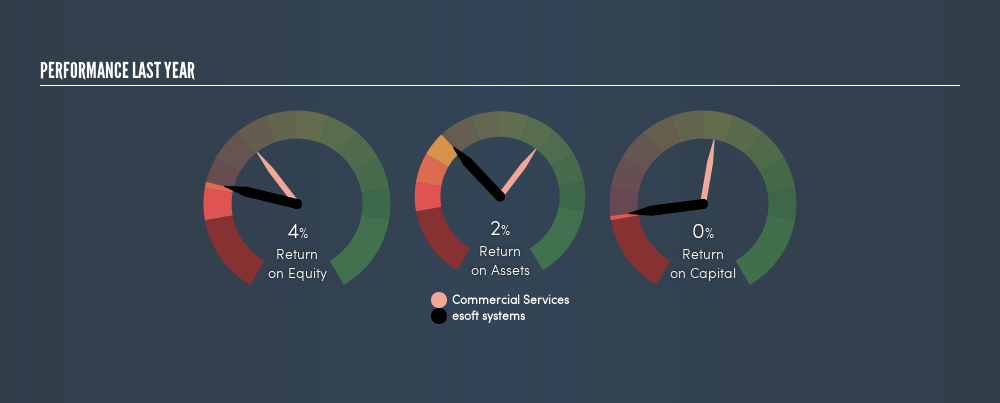
So, esoft systems has an ROCE of 0.3%.
Check out our latest analysis for esoft systems
Does esoft systems Have A Good ROCE?
ROCE is commonly used for comparing the performance of similar businesses. We can see esoft systems's ROCE is meaningfully below the Commercial Services industry average of 10%. This performance could be negative if sustained, as it suggests the business may underperform its industry. Independently of how esoft systems compares to its industry, its ROCE in absolute terms is low; especially compared to the ~0.2% available in government bonds. There are potentially more appealing investments elsewhere.
esoft systems's current ROCE of 0.3% is lower than its ROCE in the past, which was 13%, 3 years ago. Therefore we wonder if the company is facing new headwinds.
When considering this metric, keep in mind that it is backwards looking, and not necessarily predictive. ROCE can be misleading for companies in cyclical industries, with returns looking impressive during the boom times, but very weak during the busts. ROCE is only a point-in-time measure. If esoft systems is cyclical, it could make sense to check out this freegraph of past earnings, revenue and cash flow.
esoft systems's Current Liabilities And Their Impact On Its ROCE
Liabilities, such as supplier bills and bank overdrafts, are referred to as current liabilities if they need to be paid within 12 months. The ROCE equation subtracts current liabilities from capital employed, so a company with a lot of current liabilities appears to have less capital employed, and a higher ROCE than otherwise. To check the impact of this, we calculate if a company has high current liabilities relative to its total assets.
esoft systems has total assets of ø52m and current liabilities of ø5.4m. Therefore its current liabilities are equivalent to approximately 10% of its total assets. This is not a high level of current liabilities, which would not boost the ROCE by much.
Our Take On esoft systems's ROCE
While that is good to see, esoft systems has a low ROCE and does not look attractive in this analysis. Of course, you might also be able to find a better stock than esoft systems. So you may wish to see this freecollection of other companies that have grown earnings strongly.
I will like esoft systems better if I see some big insider buys. While we wait, check out this freelist of growing companies with considerable, recent, insider buying.
We aim to bring you long-term focused research analysis driven by fundamental data. Note that our analysis may not factor in the latest price-sensitive company announcements or qualitative material.
If you spot an error that warrants correction, please contact the editor at editorial-team@simplywallst.com. This article by Simply Wall St is general in nature. It does not constitute a recommendation to buy or sell any stock, and does not take account of your objectives, or your financial situation. Simply Wall St has no position in the stocks mentioned. Thank you for reading.
Market Insights

Weekly Picks

Early mover in a fast growing industry. Likely to experience share price volatility as they scale


A case for CA$31.80 (undiluted), aka 8,616% upside from CA$0.37 (an 86 bagger!).


Moderation and Stabilisation: HOLD: Fair Price based on a 4-year Cycle is $12.08
Recently Updated Narratives


An amazing opportunity to potentially get a 100 bagger

Amazon: Why the World’s Biggest Platform Still Runs on Invisible Economics

Sunrun Stock: When the Energy Transition Collides With the Cost of Capital
Popular Narratives


MicroVision will explode future revenue by 380.37% with a vision towards success


Crazy Undervalued 42 Baggers Silver Play (Active & Running Mine)


NVDA: Expanding AI Demand Will Drive Major Data Center Investments Through 2026
Trending Discussion