- Denmark
- /
- Trade Distributors
- /
- CPSE:SOLAR B
Solar's (CPH:SOLAR B) three-year total shareholder returns outpace the underlying earnings growth


Solar A/S (CPH:SOLAR B) shareholders have seen the share price descend 10% over the month. But in three years the returns have been great. In three years the stock price has launched 192% higher: a great result. It's not uncommon to see a share price retrace a bit, after a big gain. Only time will tell if there is still too much optimism currently reflected in the share price.
Since the long term performance has been good but there's been a recent pullback of 9.1%, let's check if the fundamentals match the share price.
See our latest analysis for Solar
In his essay The Superinvestors of Graham-and-Doddsville Warren Buffett described how share prices do not always rationally reflect the value of a business. One flawed but reasonable way to assess how sentiment around a company has changed is to compare the earnings per share (EPS) with the share price.
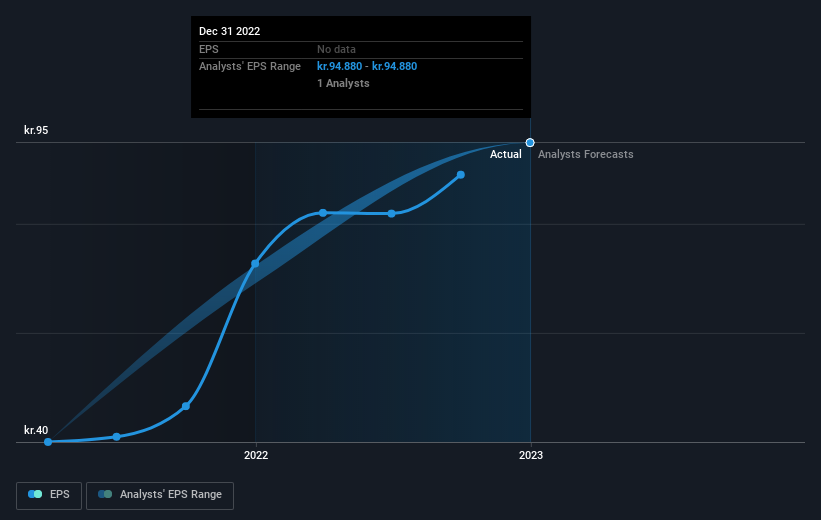
During three years of share price growth, Solar achieved compound earnings per share growth of 115% per year. This EPS growth is higher than the 43% average annual increase in the share price. Therefore, it seems the market has moderated its expectations for growth, somewhat. This cautious sentiment is reflected in its (fairly low) P/E ratio of 6.09.
You can see below how EPS has changed over time (discover the exact values by clicking on the image).
We know that Solar has improved its bottom line over the last three years, but what does the future have in store? This free interactive report on Solar's balance sheet strength is a great place to start, if you want to investigate the stock further.
What About Dividends?
It is important to consider the total shareholder return, as well as the share price return, for any given stock. The TSR incorporates the value of any spin-offs or discounted capital raisings, along with any dividends, based on the assumption that the dividends are reinvested. Arguably, the TSR gives a more comprehensive picture of the return generated by a stock. We note that for Solar the TSR over the last 3 years was 286%, which is better than the share price return mentioned above. And there's no prize for guessing that the dividend payments largely explain the divergence!
A Different Perspective
Investors in Solar had a tough year, with a total loss of 14% (including dividends), against a market gain of about 13%. Even the share prices of good stocks drop sometimes, but we want to see improvements in the fundamental metrics of a business, before getting too interested. Longer term investors wouldn't be so upset, since they would have made 15%, each year, over five years. If the fundamental data continues to indicate long term sustainable growth, the current sell-off could be an opportunity worth considering. I find it very interesting to look at share price over the long term as a proxy for business performance. But to truly gain insight, we need to consider other information, too. To that end, you should learn about the 2 warning signs we've spotted with Solar (including 1 which can't be ignored) .
But note: Solar may not be the best stock to buy. So take a peek at this free list of interesting companies with past earnings growth (and further growth forecast).
Please note, the market returns quoted in this article reflect the market weighted average returns of stocks that currently trade on Danish exchanges.
If you're looking to trade Solar, open an account with the lowest-cost platform trusted by professionals, Interactive Brokers.
With clients in over 200 countries and territories, and access to 160 markets, IBKR lets you trade stocks, options, futures, forex, bonds and funds from a single integrated account.
Enjoy no hidden fees, no account minimums, and FX conversion rates as low as 0.03%, far better than what most brokers offer.
Sponsored ContentNew: Manage All Your Stock Portfolios in One Place
We've created the ultimate portfolio companion for stock investors, and it's free.
• Connect an unlimited number of Portfolios and see your total in one currency
• Be alerted to new Warning Signs or Risks via email or mobile
• Track the Fair Value of your stocks
Have feedback on this article? Concerned about the content? Get in touch with us directly. Alternatively, email editorial-team (at) simplywallst.com.
This article by Simply Wall St is general in nature. We provide commentary based on historical data and analyst forecasts only using an unbiased methodology and our articles are not intended to be financial advice. It does not constitute a recommendation to buy or sell any stock, and does not take account of your objectives, or your financial situation. We aim to bring you long-term focused analysis driven by fundamental data. Note that our analysis may not factor in the latest price-sensitive company announcements or qualitative material. Simply Wall St has no position in any stocks mentioned.
About CPSE:SOLAR B
Solar
Operates as a sourcing and services company in electrical, heating and plumbing, ventilation, and climate and energy solutions in the Danish, Swedish, Norwegian, and Dutch markets.
Adequate balance sheet average dividend payer.
Similar Companies
Market Insights

Community Narratives

