
Advertisement
Ideally, your overall portfolio should beat the market average. But even the best stock picker will only win with some selections. So we wouldn't blame long term E.ON SE (FRA:EOAN) shareholders for doubting their decision to hold, with the stock down 29% over a half decade.
See our latest analysis for E.ON
There is no denying that markets are sometimes efficient, but prices do not always reflect underlying business performance. One flawed but reasonable way to assess how sentiment around a company has changed is to compare the earnings per share (EPS) with the share price.
During five years of share price growth, E.ON moved from a loss to profitability. Most would consider that to be a good thing, so it's counter-intuitive to see the share price declining. Other metrics may better explain the share price move.
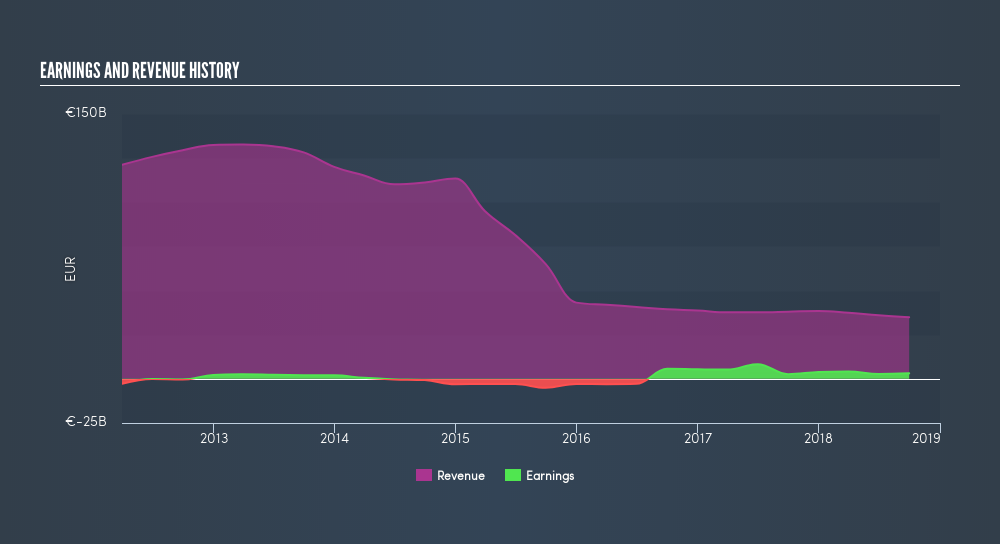
It could be that the revenue decline of 31% per year is viewed as evidence that E.ON is shrinking. That could explain the weak share price.
The chart below shows how revenue and earnings have changed with time, (if you click on the chart you can see the actual values).
E.ON is a well known stock, with plenty of analyst coverage, suggesting some visibility into future growth. If you are thinking of buying or selling E.ON stock, you should check out this freereport showing analyst consensus estimates for future profits.
What About Dividends?
When looking at investment returns, it is important to consider the difference between total shareholder return (TSR) and share price return. The TSR is a return calculation that accounts for the value of cash dividends (assuming that any dividend received was reinvested) and the calculated value of any discounted capital raisings. It's fair to say that the TSR gives a more complete picture for stocks that pay a dividend. We note that for E.ON the TSR over the last 5 years was -14%, which is better than the share price return mentioned above. And there's no prize for guessing that the dividend payments largely explain the divergence!
A Different Perspective
It's good to see that E.ON has rewarded shareholders with a total shareholder return of 20% in the last twelve months. And that does include the dividend. There's no doubt those recent returns are much better than the TSR loss of 2.9% per year over five years. This makes us a little wary, but the business might have turned around its fortunes. Keeping this in mind, a solid next step might be to take a look at E.ON's dividend track record. This freeinteractive graph is a great place to start.
But note: E.ON may not be the best stock to buy. So take a peek at this freelist of interesting companies with past earnings growth (and further growth forecast).
Please note, the market returns quoted in this article reflect the market weighted average returns of stocks that currently trade on DE exchanges.We aim to bring you long-term focused research analysis driven by fundamental data. Note that our analysis may not factor in the latest price-sensitive company announcements or qualitative material.
If you spot an error that warrants correction, please contact the editor at editorial-team@simplywallst.com. This article by Simply Wall St is general in nature. It does not constitute a recommendation to buy or sell any stock, and does not take account of your objectives, or your financial situation. Simply Wall St has no position in the stocks mentioned. Thank you for reading.
About DB:EOAN
E.ON
Operates as an energy company in Germany, the United Kingdom, Sweden, the Netherlands, rest of Europe, and internationally.
Solid track record and fair value.
Similar Companies
Market Insights


Advertisement
Community Narratives
For the Emperor: Why Games Workshop Could Be a Star Investment
Fair Value UK£160.00|0.4% overvalued
RO
Community Contributor
Securitas will boost margins with AI and tech-driven services
Fair Value SEK 260.91|44.5% undervalued
UN
Community Contributor
A Leader in EV Charging with Growth Potential
Fair Value €27.00|17.8% undervalued
TI
Community Contributor