
Advertisement
- Germany
- /
- Wireless Telecom
- /
- XTRA:FNTN
Are Poor Financial Prospects Dragging Down freenet AG (ETR:FNTN Stock?

freenet (ETR:FNTN) has had a rough month with its share price down 7.4%. To decide if this trend could continue, we decided to look at its weak fundamentals as they shape the long-term market trends. In this article, we decided to focus on freenet's ROE.
ROE or return on equity is a useful tool to assess how effectively a company can generate returns on the investment it received from its shareholders. Put another way, it reveals the company's success at turning shareholder investments into profits.
Check out our latest analysis for freenet
How Is ROE Calculated?
Return on equity can be calculated by using the formula:
Return on Equity = Net Profit (from continuing operations) ÷ Shareholders' Equity
So, based on the above formula, the ROE for freenet is:
7.8% = €108m ÷ €1.4b (Based on the trailing twelve months to September 2023).
The 'return' is the yearly profit. Another way to think of that is that for every €1 worth of equity, the company was able to earn €0.08 in profit.
Why Is ROE Important For Earnings Growth?
Thus far, we have learned that ROE measures how efficiently a company is generating its profits. We now need to evaluate how much profit the company reinvests or "retains" for future growth which then gives us an idea about the growth potential of the company. Assuming all else is equal, companies that have both a higher return on equity and higher profit retention are usually the ones that have a higher growth rate when compared to companies that don't have the same features.
freenet's Earnings Growth And 7.8% ROE
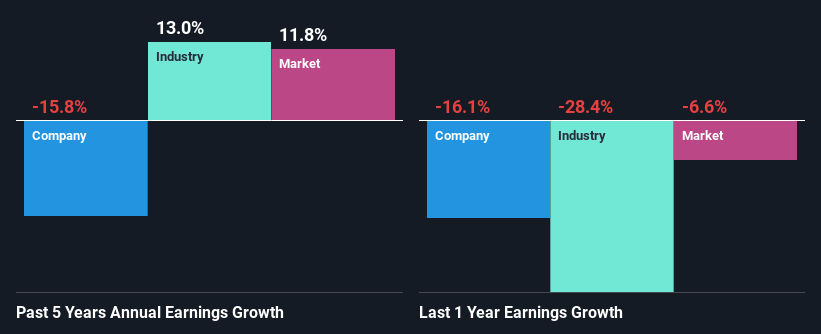
When you first look at it, freenet's ROE doesn't look that attractive. However, its ROE is similar to the industry average of 7.8%, so we won't completely dismiss the company. But freenet saw a five year net income decline of 16% over the past five years. Bear in mind, the company does have a slightly low ROE. Hence, this goes some way in explaining the shrinking earnings.
So, as a next step, we compared freenet's performance against the industry and were disappointed to discover that while the company has been shrinking its earnings, the industry has been growing its earnings at a rate of 13% over the last few years.
Earnings growth is an important metric to consider when valuing a stock. The investor should try to establish if the expected growth or decline in earnings, whichever the case may be, is priced in. By doing so, they will have an idea if the stock is headed into clear blue waters or if swampy waters await. Is freenet fairly valued compared to other companies? These 3 valuation measures might help you decide.
Is freenet Making Efficient Use Of Its Profits?
freenet's very high three-year median payout ratio of 112% over the last three years suggests that the company is paying its shareholders more than what it is earning and this explains the company's shrinking earnings. Paying a dividend beyond their means is usually not viable over the long term.
Moreover, freenet has been paying dividends for at least ten years or more suggesting that management must have perceived that the shareholders prefer dividends over earnings growth. Existing analyst estimates suggest that the company's future payout ratio is expected to drop to 75% over the next three years. As a result, the expected drop in freenet's payout ratio explains the anticipated rise in the company's future ROE to 18%, over the same period.
Conclusion
Overall, we would be extremely cautious before making any decision on freenet. The low ROE, combined with the fact that the company is paying out almost if not all, of its profits as dividends, has resulted in the lack or absence of growth in its earnings. With that said, we studied the latest analyst forecasts and found that while the company has shrunk its earnings in the past, analysts expect its earnings to grow in the future. To know more about the latest analysts predictions for the company, check out this visualization of analyst forecasts for the company.
Valuation is complex, but we're here to simplify it.
Discover if freenet might be undervalued or overvalued with our detailed analysis, featuring fair value estimates, potential risks, dividends, insider trades, and its financial condition.
Access Free AnalysisHave feedback on this article? Concerned about the content? Get in touch with us directly. Alternatively, email editorial-team (at) simplywallst.com.
This article by Simply Wall St is general in nature. We provide commentary based on historical data and analyst forecasts only using an unbiased methodology and our articles are not intended to be financial advice. It does not constitute a recommendation to buy or sell any stock, and does not take account of your objectives, or your financial situation. We aim to bring you long-term focused analysis driven by fundamental data. Note that our analysis may not factor in the latest price-sensitive company announcements or qualitative material. Simply Wall St has no position in any stocks mentioned.
About XTRA:FNTN
freenet
Provides telecommunications, broadcasting, and multimedia services for mobile communications/mobile internet, and digital lifestyle sectors in Germany.
Undervalued with excellent balance sheet and pays a dividend.
Similar Companies
Market Insights

Advertisement
Community Narratives
MicroStrategy: Volatile Gamble or Golden Opportunity?
Fair Value US$663.00|35.7% undervalued
BL
Community Contributor
Emerging Markets and Debt Reduction Will Propel Bath & Body Works Forward
Fair Value US$40.73|18.7% undervalued
ZW
Community Contributor
An amazing opportunity to potentially get a 100 bagger
Fair Value US$10.00|38.0% overvalued
DA
Community Contributor