
Advertisement
Here’s why B+S Banksysteme Aktiengesellschaft’s (FRA:DTD2) Returns On Capital Matters So Much

Today we'll look at B+S Banksysteme Aktiengesellschaft (FRA:DTD2) and reflect on its potential as an investment. Specifically, we're going to calculate its Return On Capital Employed (ROCE), in the hopes of getting some insight into the business.
First, we'll go over how we calculate ROCE. Next, we'll compare it to others in its industry. Last but not least, we'll look at what impact its current liabilities have on its ROCE.
Understanding Return On Capital Employed (ROCE)
ROCE measures the amount of pre-tax profits a company can generate from the capital employed in its business. In general, businesses with a higher ROCE are usually better quality. Overall, it is a valuable metric that has its flaws. Renowned investment researcher Michael Mauboussin has suggested that a high ROCE can indicate that 'one dollar invested in the company generates value of more than one dollar'.
So, How Do We Calculate ROCE?
Analysts use this formula to calculate return on capital employed:
Return on Capital Employed = Earnings Before Interest and Tax (EBIT) ÷ (Total Assets - Current Liabilities)
Or for B+S Banksysteme:
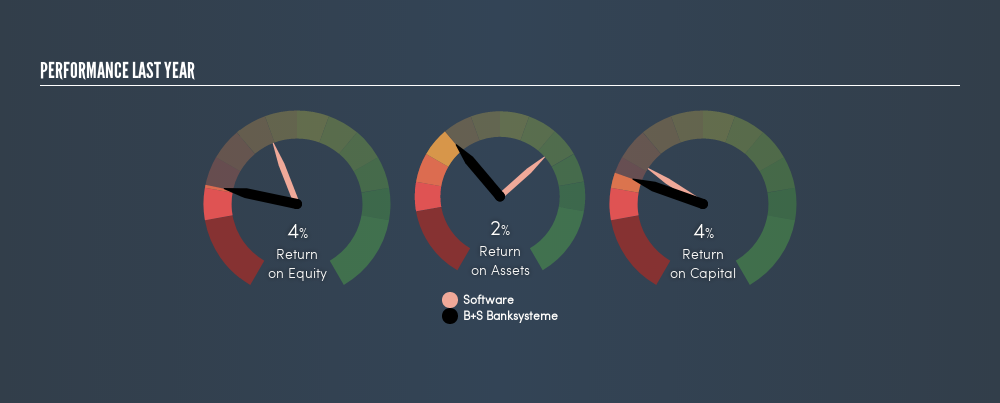
0.036 = €702k ÷ (€27m - €7.1m) (Based on the trailing twelve months to December 2018.)
Therefore, B+S Banksysteme has an ROCE of 3.6%.
View our latest analysis for B+S Banksysteme
Does B+S Banksysteme Have A Good ROCE?
ROCE is commonly used for comparing the performance of similar businesses. Using our data, B+S Banksysteme's ROCE appears to be significantly below the 10% average in the Software industry. This performance could be negative if sustained, as it suggests the business may underperform its industry. Setting aside the industry comparison for now, B+S Banksysteme's ROCE is mediocre in absolute terms, considering the risk of investing in stocks versus the safety of a bank account. Readers may find more attractive investment prospects elsewhere.
B+S Banksysteme's current ROCE of 3.6% is lower than 3 years ago, when the company reported a 5.1% ROCE. So investors might consider if it has had issues recently.
Remember that this metric is backwards looking - it shows what has happened in the past, and does not accurately predict the future. ROCE can be deceptive for cyclical businesses, as returns can look incredible in boom times, and terribly low in downturns. This is because ROCE only looks at one year, instead of considering returns across a whole cycle. Since the future is so important for investors, you should check out our free report on analyst forecasts for B+S Banksysteme.
Do B+S Banksysteme's Current Liabilities Skew Its ROCE?
Short term (or current) liabilities, are things like supplier invoices, overdrafts, or tax bills that need to be paid within 12 months. Due to the way the ROCE equation works, having large bills due in the near term can make it look as though a company has less capital employed, and thus a higher ROCE than usual. To counter this, investors can check if a company has high current liabilities relative to total assets.
B+S Banksysteme has total assets of €27m and current liabilities of €7.1m. As a result, its current liabilities are equal to approximately 27% of its total assets. This very reasonable level of current liabilities would not boost the ROCE by much.
The Bottom Line On B+S Banksysteme's ROCE
If B+S Banksysteme continues to earn an uninspiring ROCE, there may be better places to invest. You might be able to find a better investment than B+S Banksysteme. If you want a selection of possible winners, check out this free list of interesting companies that trade on a P/E below 20 (but have proven they can grow earnings).
For those who like to find winning investments this free list of growing companies with recent insider purchasing, could be just the ticket.
We aim to bring you long-term focused research analysis driven by fundamental data. Note that our analysis may not factor in the latest price-sensitive company announcements or qualitative material.
If you spot an error that warrants correction, please contact the editor at editorial-team@simplywallst.com. This article by Simply Wall St is general in nature. It does not constitute a recommendation to buy or sell any stock, and does not take account of your objectives, or your financial situation. Simply Wall St has no position in the stocks mentioned. Thank you for reading.
About DB:DTD2
B+S Banksysteme
Provides software solutions for banks and financial service providers.
Undervalued with solid track record.
Market Insights


Advertisement
Community Narratives
The Future of Drug Testing? Fingerprint Tech Shows Serious Promise
Fair Value US$2.98|40.3% undervalued
JO
Community Contributor
Suncorp’s Next Chapter: Insurance-Only and Ready to Grow
Fair Value AU$22.83|7.9% undervalued
RO
Community Contributor
Thyssenkrupp Nucera Will Achieve Double-Digit Profits by 2030 Boosted by Hydrogen Growth
Fair Value €14.40|31.6% undervalued
CH
Community Contributor
Tesla’s Nvidia Moment – The AI & Robotics Inflection Point
Fair Value US$359.72|12.3% undervalued
BL
Community Contributor