
Advertisement
If you are eyeing SAP and wondering whether now is the moment to jump in, you are definitely not alone. The company has been drawing attention with its steady climb, giving investors plenty of reasons to consider their next move. Over the past month, SAP stock has gained 6.1%, and if you zoom out to the past year, the growth stands at an appealing 9.5%. While the year-to-date return is still in slightly negative territory at -3.2%, SAP’s long-term trajectory is hard to ignore, boasting a 162.6% three-year return and 100.7% growth over five years.
Some of these moves reflect a broader surge of optimism around digital transformation and shifting enterprise tech priorities, where SAP remains a key player. The market seems to be reassessing risk as strong demand for business software continues to push valuations higher across the sector. Investors are clearly paying attention, and not just to headlines, but to real, measurable momentum in the business.
So, is SAP still undervalued, or has the ship sailed? Looking at our valuation checks, SAP earns a score of 3 out of 6, meaning it appears undervalued in half of the indicators we track. If you are weighing entry or trying to confirm your instincts to stay put, let’s dive into what these different valuation methods tell us, and why the best way to judge SAP’s value might just be the last one we cover.
Approach 1: SAP Discounted Cash Flow (DCF) Analysis
The Discounted Cash Flow (DCF) model projects a company’s expected future cash flows and then discounts them back to their worth in today’s terms. This approach aims to estimate what SAP should actually be worth right now, accounting for both current performance and long-term growth potential.
For SAP, the latest twelve months’ Free Cash Flow comes in at approximately €6.3 billion. Looking forward, analysts expect substantial growth, forecasting Free Cash Flow to reach €11.4 billion by the end of 2027. While analysts provide solid estimates for the next five years, figures beyond that are extrapolated by Simply Wall St with ten-year projections indicating steady growth well above €15 billion. All cash flow values are calculated in euros.
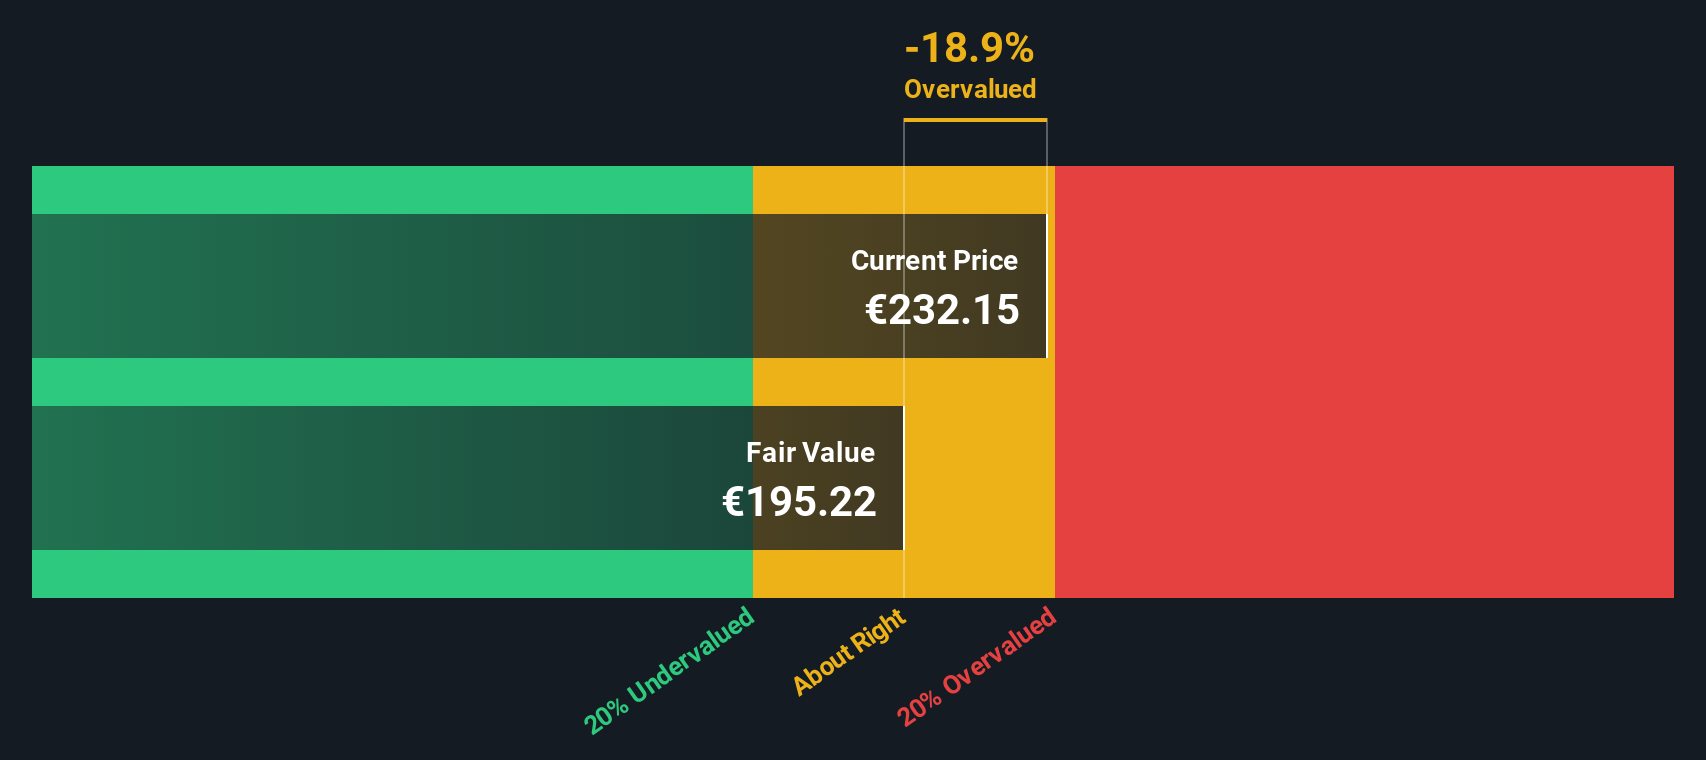
Based on these cash flow projections, the DCF model arrives at an intrinsic value for SAP of €248.09 per share. This represents a discount of 6.9% compared to the current market price, suggesting that the share price is quite close to its estimated fair value with only a mild undervaluation.
Result: ABOUT RIGHT
Simply Wall St performs a valuation analysis on every stock in the world every day (check out SAP's valuation analysis). We show the entire calculation in full. You can track the result in your watchlist or portfolio and be alerted when this changes.
Approach 2: SAP Price vs Earnings
The Price-to-Earnings (PE) ratio is widely regarded as the preferred valuation multiple for profitable companies like SAP. This metric highlights what investors are willing to pay today for each euro of current earnings, making it particularly valuable for assessing established businesses with consistent profitability.
However, a fair PE ratio is not set in stone. It shifts based on growth expectations and risk. Faster growing companies or those with less risk often command higher multiples, while slow-growth or riskier names trade at lower ones. SAP currently trades at a PE ratio of 41.12x, above the software industry average of 29.28x and the typical peer average of 35.53x. At first glance, this suggests investors have lofty expectations for SAP relative to many competitors.
Simply Wall St’s Fair Ratio provides an even sharper lens by weighing factors like SAP's earnings growth, industry positioning, profit margin, market cap, and company-specific risks. Unlike a simple peer or industry comparison, this proprietary metric is designed to home in on what would be a reasonable PE for SAP’s unique profile. In SAP’s case, the Fair Ratio stands at 42.21x, which is only marginally above SAP's actual ratio.
With SAP’s current PE ratio just a hair below its Fair Ratio, both metrics point to shares being fairly valued by the market.
Result: ABOUT RIGHT

PE ratios tell one story, but what if the real opportunity lies elsewhere? Discover companies where insiders are betting big on explosive growth.
Upgrade Your Decision Making: Choose your SAP Narrative
Earlier we mentioned that there’s an even better way to understand valuation, so let's introduce you to Narratives. A Narrative is simply your view of SAP’s story, connecting what you believe about the company’s future (such as growth drivers, challenges, and evolving market position) to your own financial forecast and fair value estimate.
Narratives give you a structured way to tie together your assumptions about SAP’s future revenue, margins, and earnings with current numbers, resulting in a personalized fair value. They make it easy to compare your fair value to today’s price, guiding buy or sell decisions, and are available for anyone to use within the Simply Wall St Community page.
What makes Narratives especially powerful is their dynamic nature; whenever new information emerges, such as news or earnings updates, your Narrative and its fair value update automatically. For example, the highest analyst price target for SAP is €345, reflecting strong growth and margin expectations, while the lowest is €192, showing how different perspectives and stories can lead to very different estimates. This means you can always find a Narrative that matches your own outlook.
Do you think there's more to the story for SAP? Create your own Narrative to let the Community know!

This article by Simply Wall St is general in nature. We provide commentary based on historical data and analyst forecasts only using an unbiased methodology and our articles are not intended to be financial advice. It does not constitute a recommendation to buy or sell any stock, and does not take account of your objectives, or your financial situation. We aim to bring you long-term focused analysis driven by fundamental data. Note that our analysis may not factor in the latest price-sensitive company announcements or qualitative material. Simply Wall St has no position in any stocks mentioned.
New: Manage All Your Stock Portfolios in One Place
We've created the ultimate portfolio companion for stock investors, and it's free.
• Connect an unlimited number of Portfolios and see your total in one currency
• Be alerted to new Warning Signs or Risks via email or mobile
• Track the Fair Value of your stocks
Have feedback on this article? Concerned about the content? Get in touch with us directly. Alternatively, email editorial-team@simplywallst.com
About XTRA:SAP
Flawless balance sheet with proven track record and pays a dividend.
Similar Companies
Market Insights

Advertisement
Community Narratives
Kodiak AI - a potential 100 bagger opportunity?
Fair Value US$14.00|44.7% undervalued
DA
Community Contributor
A Fair Price for a Great Business Facing Real Threats
Fair Value US$383.06|13.0% undervalued
IM
Community Contributor
AXON And Shopify Integration Will Unlock Global Mobile Advertising
Fair Value US$646.30|0% overvalued
AN
Based on Analyst Price Targets