Revenues Tell The Story For IBU-tec advanced materials AG (ETR:IBU) As Its Stock Soars 34%
Those holding IBU-tec advanced materials AG (ETR:IBU) shares would be relieved that the share price has rebounded 34% in the last thirty days, but it needs to keep going to repair the recent damage it has caused to investor portfolios. But the last month did very little to improve the 61% share price decline over the last year.
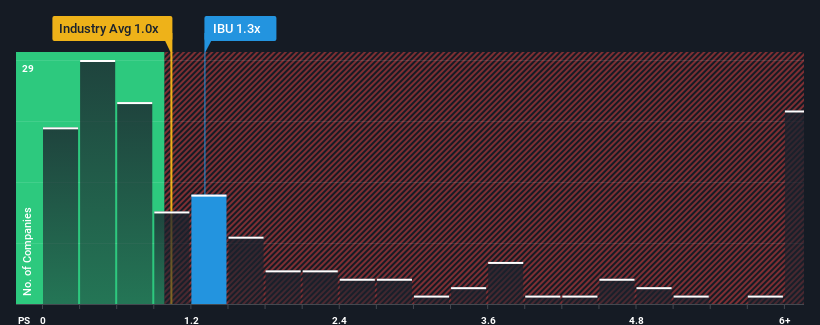
After such a large jump in price, you could be forgiven for thinking IBU-tec advanced materials is a stock not worth researching with a price-to-sales ratios (or "P/S") of 1.3x, considering almost half the companies in Germany's Chemicals industry have P/S ratios below 0.7x. However, the P/S might be high for a reason and it requires further investigation to determine if it's justified.
See our latest analysis for IBU-tec advanced materials

How Has IBU-tec advanced materials Performed Recently?
With only a limited decrease in revenue compared to most other companies of late, IBU-tec advanced materials has been doing relatively well. It seems that many are expecting the comparatively superior revenue performance to persist, which has increased investors’ willingness to pay up for the stock. While you'd prefer that its revenue trajectory turned around, you'd at least be hoping it remains less negative than other companies, otherwise you're paying a pretty hefty price for no particular reason.
If you'd like to see what analysts are forecasting going forward, you should check out our free report on IBU-tec advanced materials.Is There Enough Revenue Growth Forecasted For IBU-tec advanced materials?
In order to justify its P/S ratio, IBU-tec advanced materials would need to produce impressive growth in excess of the industry.
In reviewing the last year of financials, we were disheartened to see the company's revenues fell to the tune of 9.5%. However, a few very strong years before that means that it was still able to grow revenue by an impressive 49% in total over the last three years. Accordingly, while they would have preferred to keep the run going, shareholders would definitely welcome the medium-term rates of revenue growth.
Turning to the outlook, the next three years should generate growth of 21% each year as estimated by the one analyst watching the company. That's shaping up to be materially higher than the 3.5% per annum growth forecast for the broader industry.
With this in mind, it's not hard to understand why IBU-tec advanced materials' P/S is high relative to its industry peers. It seems most investors are expecting this strong future growth and are willing to pay more for the stock.
The Key Takeaway
IBU-tec advanced materials shares have taken a big step in a northerly direction, but its P/S is elevated as a result. Generally, our preference is to limit the use of the price-to-sales ratio to establishing what the market thinks about the overall health of a company.
Our look into IBU-tec advanced materials shows that its P/S ratio remains high on the merit of its strong future revenues. It appears that shareholders are confident in the company's future revenues, which is propping up the P/S. Unless these conditions change, they will continue to provide strong support to the share price.
Before you settle on your opinion, we've discovered 2 warning signs for IBU-tec advanced materials (1 is concerning!) that you should be aware of.
It's important to make sure you look for a great company, not just the first idea you come across. So if growing profitability aligns with your idea of a great company, take a peek at this free list of interesting companies with strong recent earnings growth (and a low P/E).
New: AI Stock Screener & Alerts
Our new AI Stock Screener scans the market every day to uncover opportunities.
• Dividend Powerhouses (3%+ Yield)
• Undervalued Small Caps with Insider Buying
• High growth Tech and AI Companies
Or build your own from over 50 metrics.
Have feedback on this article? Concerned about the content? Get in touch with us directly. Alternatively, email editorial-team (at) simplywallst.com.
This article by Simply Wall St is general in nature. We provide commentary based on historical data and analyst forecasts only using an unbiased methodology and our articles are not intended to be financial advice. It does not constitute a recommendation to buy or sell any stock, and does not take account of your objectives, or your financial situation. We aim to bring you long-term focused analysis driven by fundamental data. Note that our analysis may not factor in the latest price-sensitive company announcements or qualitative material. Simply Wall St has no position in any stocks mentioned.
About XTRA:IBU
IBU-tec advanced materials
Offers services and products for the chemical industry Germany, rest of Europe, and internationally.
Excellent balance sheet with limited growth.
Market Insights
Community Narratives


