
Advertisement
IBU-tec advanced materials AG (ETR:IBU) Stock's 31% Dive Might Signal An Opportunity But It Requires Some Scrutiny
To the annoyance of some shareholders, IBU-tec advanced materials AG (ETR:IBU) shares are down a considerable 31% in the last month, which continues a horrid run for the company. The recent drop completes a disastrous twelve months for shareholders, who are sitting on a 68% loss during that time.
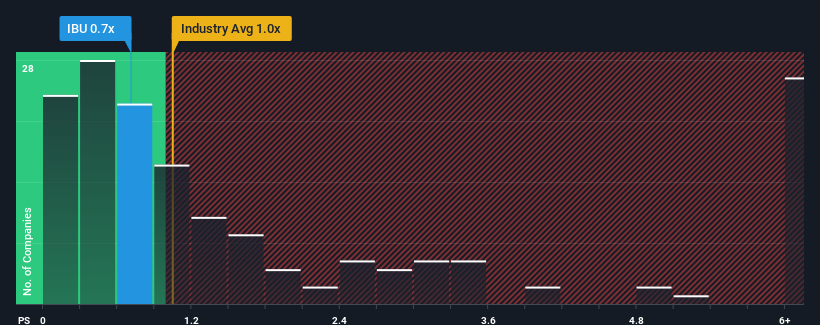
Although its price has dipped substantially, it's still not a stretch to say that IBU-tec advanced materials' price-to-sales (or "P/S") ratio of 0.7x right now seems quite "middle-of-the-road" compared to the Chemicals industry in Germany, seeing as it matches the P/S ratio of the wider industry. While this might not raise any eyebrows, if the P/S ratio is not justified investors could be missing out on a potential opportunity or ignoring looming disappointment.
See our latest analysis for IBU-tec advanced materials
How Has IBU-tec advanced materials Performed Recently?
IBU-tec advanced materials has been doing a reasonable job lately as its revenue hasn't declined as much as most other companies. Perhaps the market is expecting future revenue performance fall back in line with the poorer industry performance, which has kept the P/S contained. So while you could say the stock is cheap, investors will be looking for improvement before they see it as good value. In saying that, existing shareholders probably aren't too pessimistic about the share price if the company's revenue continues outplaying the industry.
Want the full picture on analyst estimates for the company? Then our free report on IBU-tec advanced materials will help you uncover what's on the horizon.Do Revenue Forecasts Match The P/S Ratio?
The only time you'd be comfortable seeing a P/S like IBU-tec advanced materials' is when the company's growth is tracking the industry closely.
Taking a look back first, the company's revenue growth last year wasn't something to get excited about as it posted a disappointing decline of 9.5%. Still, the latest three year period has seen an excellent 49% overall rise in revenue, in spite of its unsatisfying short-term performance. Although it's been a bumpy ride, it's still fair to say the revenue growth recently has been more than adequate for the company.
Turning to the outlook, the next three years should generate growth of 21% per annum as estimated by the one analyst watching the company. With the industry only predicted to deliver 4.8% each year, the company is positioned for a stronger revenue result.
With this in consideration, we find it intriguing that IBU-tec advanced materials' P/S is closely matching its industry peers. It may be that most investors aren't convinced the company can achieve future growth expectations.
The Bottom Line On IBU-tec advanced materials' P/S
Following IBU-tec advanced materials' share price tumble, its P/S is just clinging on to the industry median P/S. It's argued the price-to-sales ratio is an inferior measure of value within certain industries, but it can be a powerful business sentiment indicator.
Despite enticing revenue growth figures that outpace the industry, IBU-tec advanced materials' P/S isn't quite what we'd expect. There could be some risks that the market is pricing in, which is preventing the P/S ratio from matching the positive outlook. However, if you agree with the analysts' forecasts, you may be able to pick up the stock at an attractive price.
It's always necessary to consider the ever-present spectre of investment risk. We've identified 2 warning signs with IBU-tec advanced materials, and understanding them should be part of your investment process.
If these risks are making you reconsider your opinion on IBU-tec advanced materials, explore our interactive list of high quality stocks to get an idea of what else is out there.
New: AI Stock Screener & Alerts
Our new AI Stock Screener scans the market every day to uncover opportunities.
• Dividend Powerhouses (3%+ Yield)
• Undervalued Small Caps with Insider Buying
• High growth Tech and AI Companies
Or build your own from over 50 metrics.
Have feedback on this article? Concerned about the content? Get in touch with us directly. Alternatively, email editorial-team (at) simplywallst.com.
This article by Simply Wall St is general in nature. We provide commentary based on historical data and analyst forecasts only using an unbiased methodology and our articles are not intended to be financial advice. It does not constitute a recommendation to buy or sell any stock, and does not take account of your objectives, or your financial situation. We aim to bring you long-term focused analysis driven by fundamental data. Note that our analysis may not factor in the latest price-sensitive company announcements or qualitative material. Simply Wall St has no position in any stocks mentioned.
About XTRA:IBU
IBU-tec advanced materials
Offers services and products for the chemical industry Germany, rest of Europe, and internationally.
Excellent balance sheet with limited growth.
Market Insights

Advertisement
Community Narratives
MINISO's fair value is projected at 26.69 with an anticipated PE ratio shift of 20x
Fair Value US$24.03|11.0% undervalued
BE
Community Contributor
Procter & Gamble: A Dividend Giant Facing Slowing Growth
Fair Value US$119.81|23.3% overvalued
AN
Community Contributor
Eli Lilly's Future Growth Driven by Tirzepatide and Favorable Market Conditions
Fair Value US$1.19k|13.8% undervalued
EA
Community Contributor