Stock Analysis
- Germany
- /
- Hospitality
- /
- XTRA:TUI1
The five-year loss for TUI (ETR:TUI1) shareholders likely driven by its shrinking earnings


Statistically speaking, long term investing is a profitable endeavour. But no-one is immune from buying too high. For example, after five long years the TUI AG (ETR:TUI1) share price is a whole 92% lower. That's an unpleasant experience for long term holders. But it's up 5.6% in the last week. While a drop like that is definitely a body blow, money isn't as important as health and happiness.
On a more encouraging note the company has added €181m to its market cap in just the last 7 days, so let's see if we can determine what's driven the five-year loss for shareholders.
View our latest analysis for TUI
There is no denying that markets are sometimes efficient, but prices do not always reflect underlying business performance. By comparing earnings per share (EPS) and share price changes over time, we can get a feel for how investor attitudes to a company have morphed over time.
During five years of share price growth, TUI moved from a loss to profitability. That would generally be considered a positive, so we are surprised to see the share price is down. Other metrics might give us a better handle on how its value is changing over time.
Revenue is actually up 6.1% over the time period. So it seems one might have to take closer look at the fundamentals to understand why the share price languishes. After all, there may be an opportunity.
You can see how earnings and revenue have changed over time in the image below (click on the chart to see the exact values).
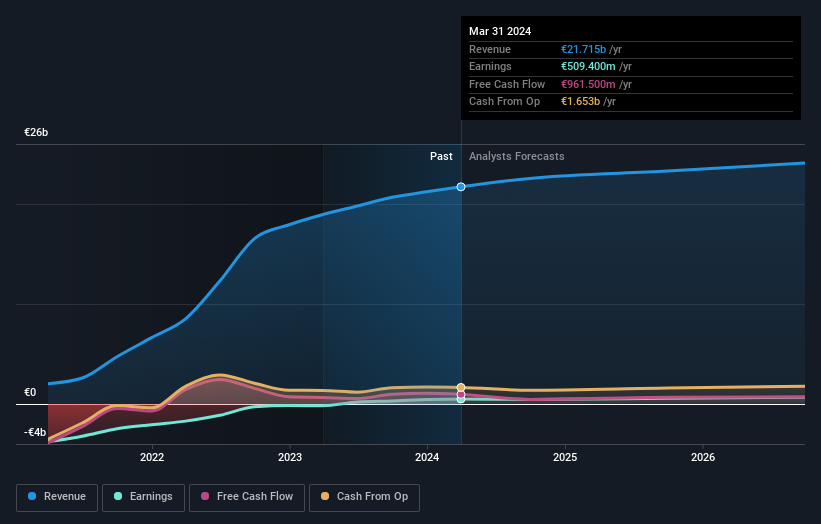
TUI is a well known stock, with plenty of analyst coverage, suggesting some visibility into future growth. Given we have quite a good number of analyst forecasts, it might be well worth checking out this free chart depicting consensus estimates.
What About The Total Shareholder Return (TSR)?
We'd be remiss not to mention the difference between TUI's total shareholder return (TSR) and its share price return. The TSR is a return calculation that accounts for the value of cash dividends (assuming that any dividend received was reinvested) and the calculated value of any discounted capital raisings and spin-offs. Dividends have been really beneficial for TUI shareholders, and that cash payout explains why its total shareholder loss of 68%, over the last 5 years, isn't as bad as the share price return.
A Different Perspective
It's good to see that TUI has rewarded shareholders with a total shareholder return of 11% in the last twelve months. That certainly beats the loss of about 11% per year over the last half decade. We generally put more weight on the long term performance over the short term, but the recent improvement could hint at a (positive) inflection point within the business. Before deciding if you like the current share price, check how TUI scores on these 3 valuation metrics.
If you would prefer to check out another company -- one with potentially superior financials -- then do not miss this free list of companies that have proven they can grow earnings.
Please note, the market returns quoted in this article reflect the market weighted average returns of stocks that currently trade on German exchanges.
Valuation is complex, but we're helping make it simple.
Find out whether TUI is potentially over or undervalued by checking out our comprehensive analysis, which includes fair value estimates, risks and warnings, dividends, insider transactions and financial health.
View the Free AnalysisHave feedback on this article? Concerned about the content? Get in touch with us directly. Alternatively, email editorial-team (at) simplywallst.com.
This article by Simply Wall St is general in nature. We provide commentary based on historical data and analyst forecasts only using an unbiased methodology and our articles are not intended to be financial advice. It does not constitute a recommendation to buy or sell any stock, and does not take account of your objectives, or your financial situation. We aim to bring you long-term focused analysis driven by fundamental data. Note that our analysis may not factor in the latest price-sensitive company announcements or qualitative material. Simply Wall St has no position in any stocks mentioned.
About XTRA:TUI1
Undervalued with acceptable track record.
