PUMA (XTRA:PUM) shares have seen some ups and downs in recent months, sparking fresh debate about the company’s outlook. Investors are taking a closer look at value, particularly after a tough year for returns.
After a tough slide since the start of the year, PUMA’s 1-year total shareholder return sits at -53.84%. This makes the recent 8.8% drop in its share price feel less like a blip and more a signal that momentum remains under pressure. Longer-term shareholders have seen similar declines, but short bursts of recovery, like the modest 90-day share price gain of 2.62%, suggest some are still watching for a turn.
With shares trading well below analyst price targets and a challenging year behind it, the question now is whether PUMA is trading at a discount or if the market has already accounted for all the risks and future potential.
Advertisement
Price-to-Sales of 0.3x: Is it justified?
With PUMA trading at a price-to-sales ratio of just 0.3x, the shares sit well below both peer and industry averages. This suggests strong relative value at the last close price of €18.78.
The price-to-sales ratio compares the company's market capitalization to its total sales, providing investors with a quick sense of how the market is valuing every euro of PUMA's revenue. For consumer-focused brands, particularly in fashion and luxury goods, this multiple is a popular measure of perceived growth potential and profitability.
PUMA's price-to-sales is half the industry average and less than half the peer group average. This reinforces the notion that the company is being marked down by the market. If the price-to-sales moves closer to the estimated fair ratio of 0.7x, there could be significant upside if fundamentals stabilize or improve.
However, persistent negative earnings and slow revenue growth remain concerns. These factors could challenge any swift reversal in PUMA’s current valuation story.
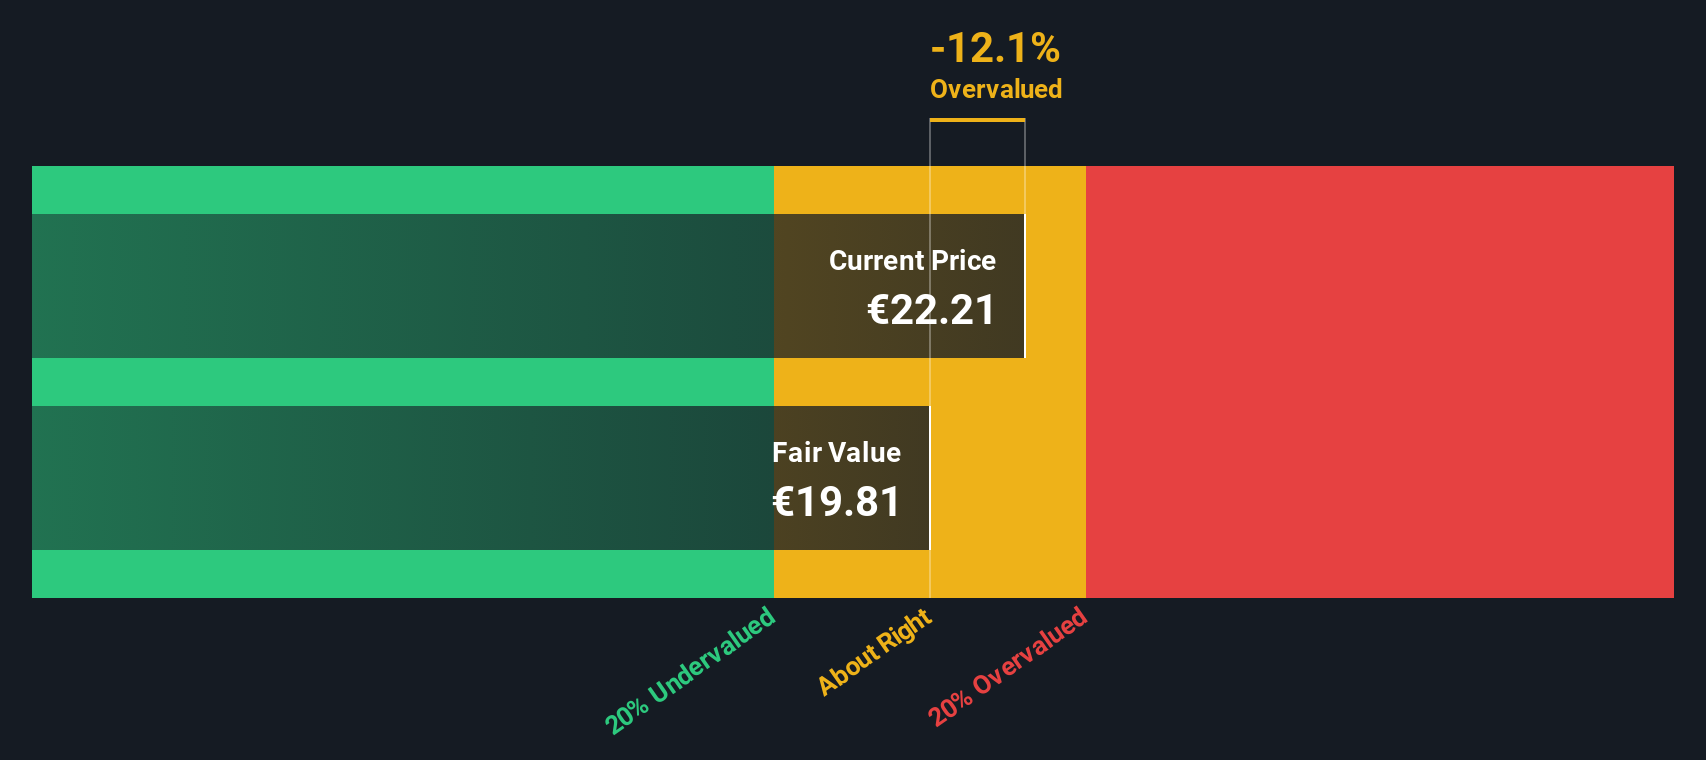
While the price-to-sales ratio hints at strong value, our SWS DCF model puts PUMA's fair value at €19.35, slightly below where the shares last traded. This suggests the market may not be severely underestimating future cash flows after all. Could near-term optimism in the stock be overdone?
Simply Wall St performs a discounted cash flow (DCF) on every stock in the world every day (check out PUMA for example). We show the entire calculation in full. You can track the result in your watchlist or portfolio and be alerted when this changes, or use our stock screener to discover 855 undervalued stocks based on their cash flows. If you save a screener we even alert you when new companies match - so you never miss a potential opportunity.
Build Your Own PUMA Narrative
If you feel differently or want to explore the company's numbers firsthand, why not dig into the details and shape your own perspective in just a few minutes with Do it your way
This article by Simply Wall St is general in nature. We provide commentary based on historical data
and analyst forecasts only using an unbiased methodology and our articles are not intended to be financial advice. It does not constitute a recommendation to buy or sell any stock, and does not take account of your objectives, or your
financial situation. We aim to bring you long-term focused analysis driven by fundamental data.
Note that our analysis may not factor in the latest price-sensitive company announcements or qualitative material.
Simply Wall St has no position in any stocks mentioned.
New: Manage All Your Stock Portfolios in One Place
We've created the ultimate portfolio companion for stock investors, and it's free.
• Connect an unlimited number of Portfolios and see your total in one currency • Be alerted to new Warning Signs or Risks via email or mobile • Track the Fair Value of your stocks
Engages in the development and sale of sports and sports lifestyle products in Germany, rest of Europe, the United States, North America, and internationally.