
Advertisement
Returns On Capital Are Showing Encouraging Signs At STS Group (ETR:SF3)
There are a few key trends to look for if we want to identify the next multi-bagger. Firstly, we'll want to see a proven return on capital employed (ROCE) that is increasing, and secondly, an expanding base of capital employed. Ultimately, this demonstrates that it's a business that is reinvesting profits at increasing rates of return. With that in mind, we've noticed some promising trends at STS Group (ETR:SF3) so let's look a bit deeper.
Return On Capital Employed (ROCE): What Is It?
Just to clarify if you're unsure, ROCE is a metric for evaluating how much pre-tax income (in percentage terms) a company earns on the capital invested in its business. To calculate this metric for STS Group, this is the formula:
Return on Capital Employed = Earnings Before Interest and Tax (EBIT) ÷ (Total Assets - Current Liabilities)
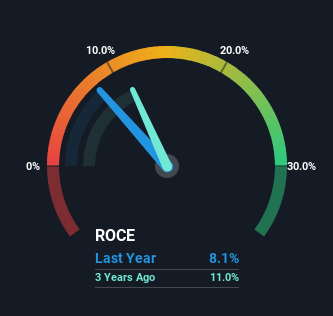
0.081 = €8.8m ÷ (€265m - €156m) (Based on the trailing twelve months to June 2024).
So, STS Group has an ROCE of 8.1%. On its own, that's a low figure but it's around the 9.1% average generated by the Machinery industry.
Check out our latest analysis for STS Group
In the above chart we have measured STS Group's prior ROCE against its prior performance, but the future is arguably more important. If you're interested, you can view the analysts predictions in our free analyst report for STS Group .
What The Trend Of ROCE Can Tell Us
We're pretty happy with how the ROCE has been trending at STS Group. We found that the returns on capital employed over the last five years have risen by 169%. That's a very favorable trend because this means that the company is earning more per dollar of capital that's being employed. Interestingly, the business may be becoming more efficient because it's applying 21% less capital than it was five years ago. STS Group may be selling some assets so it's worth investigating if the business has plans for future investments to increase returns further still.
On a side note, STS Group's current liabilities are still rather high at 59% of total assets. This effectively means that suppliers (or short-term creditors) are funding a large portion of the business, so just be aware that this can introduce some elements of risk. Ideally we'd like to see this reduce as that would mean fewer obligations bearing risks.
In Conclusion...
In summary, it's great to see that STS Group has been able to turn things around and earn higher returns on lower amounts of capital. Astute investors may have an opportunity here because the stock has declined 26% in the last five years. That being the case, research into the company's current valuation metrics and future prospects seems fitting.
One more thing, we've spotted 1 warning sign facing STS Group that you might find interesting.
For those who like to invest in solid companies, check out this free list of companies with solid balance sheets and high returns on equity.
New: Manage All Your Stock Portfolios in One Place
We've created the ultimate portfolio companion for stock investors, and it's free.
• Connect an unlimited number of Portfolios and see your total in one currency
• Be alerted to new Warning Signs or Risks via email or mobile
• Track the Fair Value of your stocks
Have feedback on this article? Concerned about the content? Get in touch with us directly. Alternatively, email editorial-team (at) simplywallst.com.
This article by Simply Wall St is general in nature. We provide commentary based on historical data and analyst forecasts only using an unbiased methodology and our articles are not intended to be financial advice. It does not constitute a recommendation to buy or sell any stock, and does not take account of your objectives, or your financial situation. We aim to bring you long-term focused analysis driven by fundamental data. Note that our analysis may not factor in the latest price-sensitive company announcements or qualitative material. Simply Wall St has no position in any stocks mentioned.
About XTRA:SF3
STS Group
Supplies components and systems for the commercial vehicle and automotive industry in Germany, France, Mexico, the United States, and China.
Flawless balance sheet and undervalued.
Similar Companies
Market Insights

Advertisement
Community Narratives
Quality at a Premium. A time to watch, not to buy?
Fair Value US$154.56|29.0% undervalued
DA
Community Contributor
GRAB: The Super-App at the Heart of Southeast Asia’s Digital Boom
Fair Value US$8.20|22.6% undervalued
BL
Community Contributor
Verve Group to Surge with 51.61% Revenue Growth
Fair Value €6.00|60.1% undervalued
ME
Community Contributor