
Advertisement
Here's Why KION GROUP (ETR:KGX) Can Manage Its Debt Responsibly

Some say volatility, rather than debt, is the best way to think about risk as an investor, but Warren Buffett famously said that 'Volatility is far from synonymous with risk. So it seems the smart money knows that debt - which is usually involved in bankruptcies - is a very important factor, when you assess how risky a company is. We can see that KION GROUP AG (ETR:KGX) does use debt in its business. But should shareholders be worried about its use of debt?
When Is Debt Dangerous?
Debt assists a business until the business has trouble paying it off, either with new capital or with free cash flow. In the worst case scenario, a company can go bankrupt if it cannot pay its creditors. While that is not too common, we often do see indebted companies permanently diluting shareholders because lenders force them to raise capital at a distressed price. Of course, plenty of companies use debt to fund growth, without any negative consequences. The first thing to do when considering how much debt a business uses is to look at its cash and debt together.
See our latest analysis for KION GROUP
What Is KION GROUP's Debt?
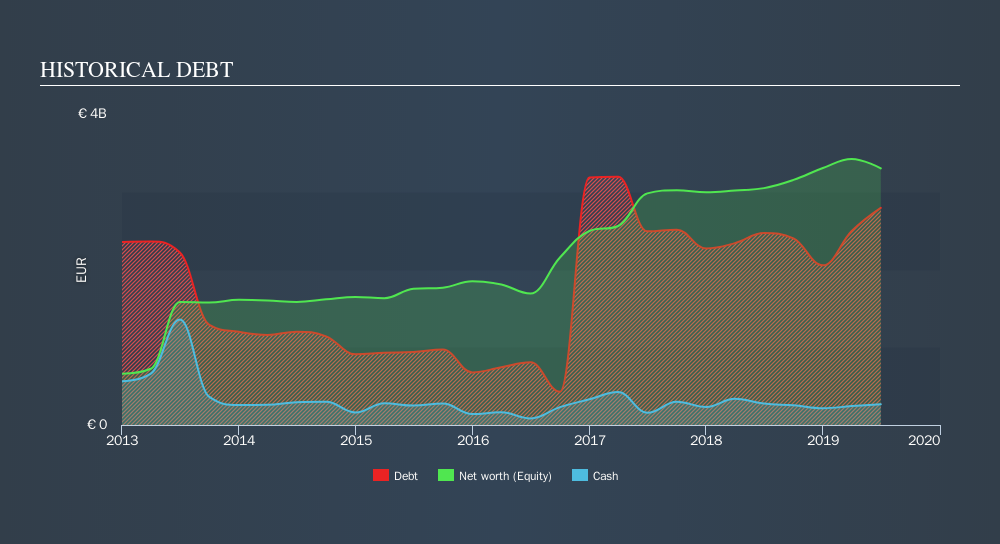
The image below, which you can click on for greater detail, shows that KION GROUP had debt of €2.79b at the end of June 2019, a reduction from €3.95b over a year. On the flip side, it has €267.3m in cash leading to net debt of about €2.53b.
How Healthy Is KION GROUP's Balance Sheet?
We can see from the most recent balance sheet that KION GROUP had liabilities of €4.13b falling due within a year, and liabilities of €6.12b due beyond that. On the other hand, it had cash of €267.3m and €1.59b worth of receivables due within a year. So its liabilities outweigh the sum of its cash and (near-term) receivables by €8.38b.
This deficit casts a shadow over the €5.50b company, like a colossus towering over mere mortals. So we'd watch its balance sheet closely, without a doubt At the end of the day, KION GROUP would probably need a major re-capitalization if its creditors were to demand repayment.
In order to size up a company's debt relative to its earnings, we calculate its net debt divided by its earnings before interest, tax, depreciation, and amortization (EBITDA) and its earnings before interest and tax (EBIT) divided by its interest expense (its interest cover). This way, we consider both the absolute quantum of the debt, as well as the interest rates paid on it.
KION GROUP's net debt to EBITDA ratio of about 1.7 suggests only moderate use of debt. And its strong interest cover of 10.7 times, makes us even more comfortable. Also relevant is that KION GROUP has grown its EBIT by a very respectable 25% in the last year, thus enhancing its ability to pay down debt. There's no doubt that we learn most about debt from the balance sheet. But ultimately the future profitability of the business will decide if KION GROUP can strengthen its balance sheet over time. So if you want to see what the professionals think, you might find this free report on analyst profit forecasts to be interesting.
But our final consideration is also important, because a company cannot pay debt with paper profits; it needs cold hard cash. So the logical step is to look at the proportion of that EBIT that is matched by actual free cash flow. During the last three years, KION GROUP produced sturdy free cash flow equating to 73% of its EBIT, about what we'd expect. This cold hard cash means it can reduce its debt when it wants to.
Our View
KION GROUP's level of total liabilities was a real negative on this analysis, although the other factors we considered were considerably better In particular, we are dazzled with its interest cover. When we consider all the factors mentioned above, we do feel a bit cautious about KION GROUP's use of debt. While debt does have its upside in higher potential returns, we think shareholders should definitely consider how debt levels might make the stock more risky. Over time, share prices tend to follow earnings per share, so if you're interested in KION GROUP, you may well want to click here to check an interactive graph of its earnings per share history.
Of course, if you're the type of investor who prefers buying stocks without the burden of debt, then don't hesitate to discover our exclusive list of net cash growth stocks, today.
We aim to bring you long-term focused research analysis driven by fundamental data. Note that our analysis may not factor in the latest price-sensitive company announcements or qualitative material.
If you spot an error that warrants correction, please contact the editor at editorial-team@simplywallst.com. This article by Simply Wall St is general in nature. It does not constitute a recommendation to buy or sell any stock, and does not take account of your objectives, or your financial situation. Simply Wall St has no position in the stocks mentioned. Thank you for reading.
About XTRA:KGX
KION GROUP
Provides industrial trucks and supply chain solutions in Western and Eastern Europe, the Middle East, Africa, North America, Central and South America, China, and the rest of the Asia Pacific.
Good value average dividend payer.
Similar Companies
Market Insights

Advertisement
Community Narratives
Groundbreaking therapies that could change the treatment landscape for PTSD, fibromyalgia, MS & Alzheimer’s
Fair Value US$6.20|82.7% undervalued
CM
Community Contributor
DigitalOcean Will Grow 14% by Embracing AI with Paperspace Acquisition
Fair Value US$50.00|36.8% undervalued
NE
Community Contributor
Viant Technology: A Rising AdTech Challenger in the AI-Powered CTV Market
Fair Value US$38.61|61.4% undervalued
BL
Community Contributor
Volvo will Accelerate Forward into Electric and Autonomous Leadership in Five Years
Fair Value SEK 438.80|37.1% undervalued
UN
Community Contributor