- Germany
- /
- Trade Distributors
- /
- XTRA:BNR
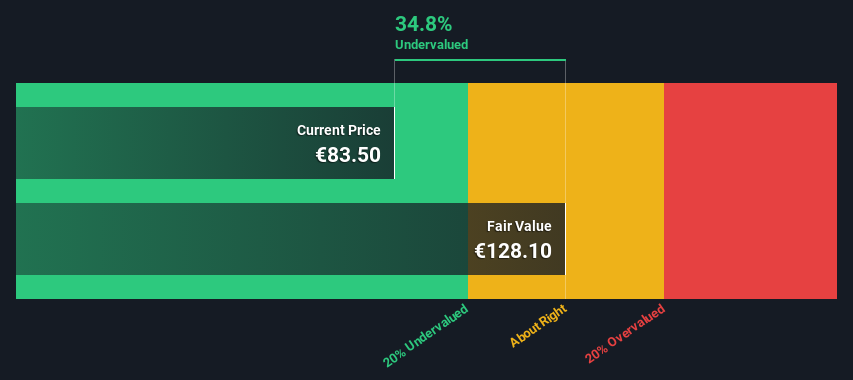
Is There An Opportunity With Brenntag SE's (ETR:BNR) 35% Undervaluation?


Key Insights
- The projected fair value for Brenntag is €128 based on 2 Stage Free Cash Flow to Equity
- Brenntag is estimated to be 35% undervalued based on current share price of €83.50
- The €86.61 analyst price target for BNR is 32% less than our estimate of fair value
Does the February share price for Brenntag SE (ETR:BNR) reflect what it's really worth? Today, we will estimate the stock's intrinsic value by projecting its future cash flows and then discounting them to today's value. One way to achieve this is by employing the Discounted Cash Flow (DCF) model. Believe it or not, it's not too difficult to follow, as you'll see from our example!
We would caution that there are many ways of valuing a company and, like the DCF, each technique has advantages and disadvantages in certain scenarios. For those who are keen learners of equity analysis, the Simply Wall St analysis model here may be something of interest to you.
View our latest analysis for Brenntag
What's The Estimated Valuation?
We're using the 2-stage growth model, which simply means we take in account two stages of company's growth. In the initial period the company may have a higher growth rate and the second stage is usually assumed to have a stable growth rate. To start off with, we need to estimate the next ten years of cash flows. Where possible we use analyst estimates, but when these aren't available we extrapolate the previous free cash flow (FCF) from the last estimate or reported value. We assume companies with shrinking free cash flow will slow their rate of shrinkage, and that companies with growing free cash flow will see their growth rate slow, over this period. We do this to reflect that growth tends to slow more in the early years than it does in later years.
Generally we assume that a dollar today is more valuable than a dollar in the future, so we discount the value of these future cash flows to their estimated value in today's dollars:
10-year free cash flow (FCF) forecast
| 2024 | 2025 | 2026 | 2027 | 2028 | 2029 | 2030 | 2031 | 2032 | 2033 | |
| Levered FCF (€, Millions) | €725.8m | €731.6m | €785.0m | €917.0m | €969.5m | €1.01b | €1.04b | €1.07b | €1.08b | €1.10b |
| Growth Rate Estimate Source | Analyst x10 | Analyst x9 | Analyst x1 | Analyst x1 | Est @ 5.73% | Est @ 4.18% | Est @ 3.09% | Est @ 2.33% | Est @ 1.80% | Est @ 1.43% |
| Present Value (€, Millions) Discounted @ 5.9% | €685 | €653 | €661 | €730 | €729 | €717 | €698 | €675 | €649 | €622 |
("Est" = FCF growth rate estimated by Simply Wall St)
Present Value of 10-year Cash Flow (PVCF) = €6.8b
We now need to calculate the Terminal Value, which accounts for all the future cash flows after this ten year period. The Gordon Growth formula is used to calculate Terminal Value at a future annual growth rate equal to the 5-year average of the 10-year government bond yield of 0.6%. We discount the terminal cash flows to today's value at a cost of equity of 5.9%.
Terminal Value (TV)= FCF2033 × (1 + g) ÷ (r – g) = €1.1b× (1 + 0.6%) ÷ (5.9%– 0.6%) = €21b
Present Value of Terminal Value (PVTV)= TV / (1 + r)10= €21b÷ ( 1 + 5.9%)10= €12b
The total value, or equity value, is then the sum of the present value of the future cash flows, which in this case is €19b. To get the intrinsic value per share, we divide this by the total number of shares outstanding. Relative to the current share price of €83.5, the company appears quite good value at a 35% discount to where the stock price trades currently. Valuations are imprecise instruments though, rather like a telescope - move a few degrees and end up in a different galaxy. Do keep this in mind.
Important Assumptions
The calculation above is very dependent on two assumptions. The first is the discount rate and the other is the cash flows. If you don't agree with these result, have a go at the calculation yourself and play with the assumptions. The DCF also does not consider the possible cyclicality of an industry, or a company's future capital requirements, so it does not give a full picture of a company's potential performance. Given that we are looking at Brenntag as potential shareholders, the cost of equity is used as the discount rate, rather than the cost of capital (or weighted average cost of capital, WACC) which accounts for debt. In this calculation we've used 5.9%, which is based on a levered beta of 1.156. Beta is a measure of a stock's volatility, compared to the market as a whole. We get our beta from the industry average beta of globally comparable companies, with an imposed limit between 0.8 and 2.0, which is a reasonable range for a stable business.
SWOT Analysis for Brenntag
- Debt is not viewed as a risk.
- Dividends are covered by earnings and cash flows.
- Earnings declined over the past year.
- Dividend is low compared to the top 25% of dividend payers in the Trade Distributors market.
- Annual earnings are forecast to grow for the next 4 years.
- Trading below our estimate of fair value by more than 20%.
- Annual earnings are forecast to grow slower than the German market.
Looking Ahead:
Although the valuation of a company is important, it is only one of many factors that you need to assess for a company. It's not possible to obtain a foolproof valuation with a DCF model. Rather it should be seen as a guide to "what assumptions need to be true for this stock to be under/overvalued?" For instance, if the terminal value growth rate is adjusted slightly, it can dramatically alter the overall result. Can we work out why the company is trading at a discount to intrinsic value? For Brenntag, there are three relevant items you should assess:
- Financial Health: Does BNR have a healthy balance sheet? Take a look at our free balance sheet analysis with six simple checks on key factors like leverage and risk.
- Future Earnings: How does BNR's growth rate compare to its peers and the wider market? Dig deeper into the analyst consensus number for the upcoming years by interacting with our free analyst growth expectation chart.
- Other High Quality Alternatives: Do you like a good all-rounder? Explore our interactive list of high quality stocks to get an idea of what else is out there you may be missing!
PS. The Simply Wall St app conducts a discounted cash flow valuation for every stock on the XTRA every day. If you want to find the calculation for other stocks just search here.
Valuation is complex, but we're here to simplify it.
Discover if Brenntag might be undervalued or overvalued with our detailed analysis, featuring fair value estimates, potential risks, dividends, insider trades, and its financial condition.
Access Free AnalysisHave feedback on this article? Concerned about the content? Get in touch with us directly. Alternatively, email editorial-team (at) simplywallst.com.
This article by Simply Wall St is general in nature. We provide commentary based on historical data and analyst forecasts only using an unbiased methodology and our articles are not intended to be financial advice. It does not constitute a recommendation to buy or sell any stock, and does not take account of your objectives, or your financial situation. We aim to bring you long-term focused analysis driven by fundamental data. Note that our analysis may not factor in the latest price-sensitive company announcements or qualitative material. Simply Wall St has no position in any stocks mentioned.
About XTRA:BNR
Brenntag
Brenntag SE purchases and supplies various industrial and specialty chemicals, and ingredients in Germany, Europe, the Middle East, Africa, the Americas, and the Asia Pacific.
Flawless balance sheet established dividend payer.
Similar Companies
Market Insights

Community Narratives


