
Advertisement
Aumann AG's (ETR:AAG) last week's 11% decline must have disappointed public companies who have a significant stake

Key Insights
- Aumann's significant public companies ownership suggests that the key decisions are influenced by shareholders from the larger public
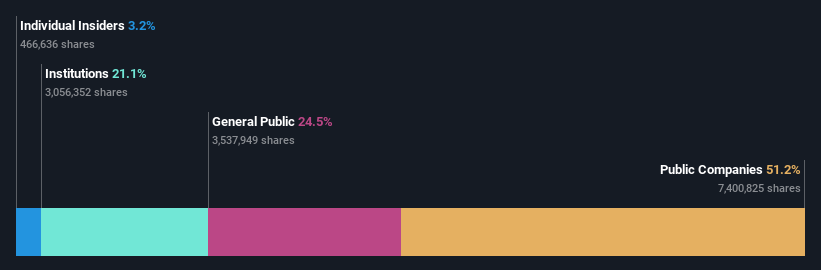
- MBB SE owns 51% of the company
- Institutional ownership in Aumann is 21%
A look at the shareholders of Aumann AG (ETR:AAG) can tell us which group is most powerful. With 51% stake, public companies possess the maximum shares in the company. Put another way, the group faces the maximum upside potential (or downside risk).
As market cap fell to €192m last week, public companies would have faced the highest losses than any other shareholder groups of the company.
In the chart below, we zoom in on the different ownership groups of Aumann.
Check out our latest analysis for Aumann
What Does The Institutional Ownership Tell Us About Aumann?
Institutional investors commonly compare their own returns to the returns of a commonly followed index. So they generally do consider buying larger companies that are included in the relevant benchmark index.
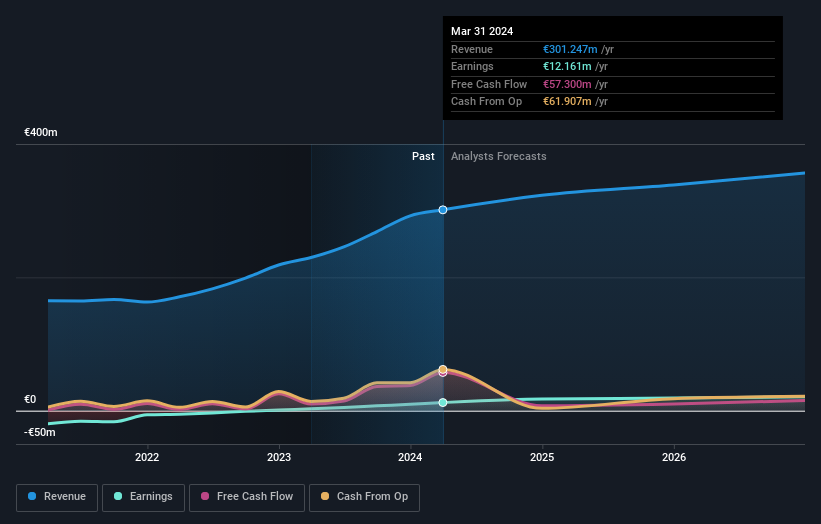
Aumann already has institutions on the share registry. Indeed, they own a respectable stake in the company. This implies the analysts working for those institutions have looked at the stock and they like it. But just like anyone else, they could be wrong. It is not uncommon to see a big share price drop if two large institutional investors try to sell out of a stock at the same time. So it is worth checking the past earnings trajectory of Aumann, (below). Of course, keep in mind that there are other factors to consider, too.
Aumann is not owned by hedge funds. MBB SE is currently the company's largest shareholder with 51% of shares outstanding. This implies that they have majority interest control of the future of the company. In comparison, the second and third largest shareholders hold about 3.2% and 3.2% of the stock.
Researching institutional ownership is a good way to gauge and filter a stock's expected performance. The same can be achieved by studying analyst sentiments. There is some analyst coverage of the stock, but it could still become more well known, with time.
Insider Ownership Of Aumann
While the precise definition of an insider can be subjective, almost everyone considers board members to be insiders. Company management run the business, but the CEO will answer to the board, even if he or she is a member of it.
I generally consider insider ownership to be a good thing. However, on some occasions it makes it more difficult for other shareholders to hold the board accountable for decisions.
Shareholders would probably be interested to learn that insiders own shares in Aumann AG. It has a market capitalization of just €192m, and insiders have €6.2m worth of shares, in their own names. This shows at least some alignment. You can click here to see if those insiders have been buying or selling.
General Public Ownership
The general public, who are usually individual investors, hold a 24% stake in Aumann. This size of ownership, while considerable, may not be enough to change company policy if the decision is not in sync with other large shareholders.
Public Company Ownership
It appears to us that public companies own 51% of Aumann. We can't be certain but it is quite possible this is a strategic stake. The businesses may be similar, or work together.
Next Steps:
I find it very interesting to look at who exactly owns a company. But to truly gain insight, we need to consider other information, too.
I always like to check for a history of revenue growth. You can too, by accessing this free chart of historic revenue and earnings in this detailed graph.
If you would prefer discover what analysts are predicting in terms of future growth, do not miss this free report on analyst forecasts.
NB: Figures in this article are calculated using data from the last twelve months, which refer to the 12-month period ending on the last date of the month the financial statement is dated. This may not be consistent with full year annual report figures.
New: Manage All Your Stock Portfolios in One Place
We've created the ultimate portfolio companion for stock investors, and it's free.
• Connect an unlimited number of Portfolios and see your total in one currency
• Be alerted to new Warning Signs or Risks via email or mobile
• Track the Fair Value of your stocks
Have feedback on this article? Concerned about the content? Get in touch with us directly. Alternatively, email editorial-team (at) simplywallst.com.
This article by Simply Wall St is general in nature. We provide commentary based on historical data and analyst forecasts only using an unbiased methodology and our articles are not intended to be financial advice. It does not constitute a recommendation to buy or sell any stock, and does not take account of your objectives, or your financial situation. We aim to bring you long-term focused analysis driven by fundamental data. Note that our analysis may not factor in the latest price-sensitive company announcements or qualitative material. Simply Wall St has no position in any stocks mentioned.
Have feedback on this article? Concerned about the content? Get in touch with us directly. Alternatively, email editorial-team@simplywallst.com
About XTRA:AAG
Aumann
Manufactures and sells specialized machines and production lines for components of electric and classic drive chain systems in Europe, the United States, Canada, Mexico, China, and internationally.
Flawless balance sheet and undervalued.
Market Insights


Advertisement
Community Narratives
The Future of Drug Testing? Fingerprint Tech Shows Serious Promise
Fair Value US$2.98|40.3% undervalued
JO
Community Contributor
Suncorp’s Next Chapter: Insurance-Only and Ready to Grow
Fair Value AU$22.83|7.9% undervalued
RO
Community Contributor
Thyssenkrupp Nucera Will Achieve Double-Digit Profits by 2030 Boosted by Hydrogen Growth
Fair Value €14.40|31.6% undervalued
CH
Community Contributor
Tesla’s Nvidia Moment – The AI & Robotics Inflection Point
Fair Value US$359.72|12.3% undervalued
BL
Community Contributor