
Advertisement

One of the best investments we can make is in our own knowledge and skill set. With that in mind, this article will work through how we can use Return On Equity (ROE) to better understand a business. To keep the lesson grounded in practicality, we'll use ROE to better understand SAF-Holland S.A. (FRA:SFQ).
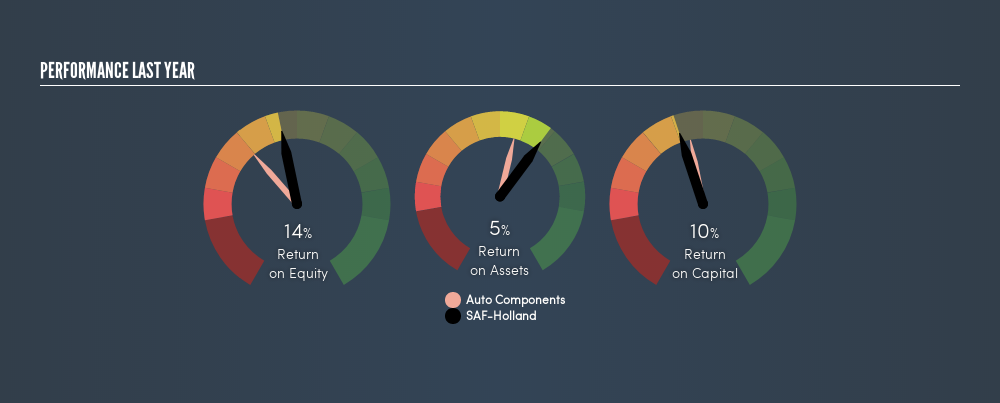
SAF-Holland has a ROE of 14%, based on the last twelve months. One way to conceptualize this, is that for each €1 of shareholders' equity it has, the company made €0.14 in profit.
Want to participate in a short research study? Help shape the future of investing tools and you could win a $250 gift card!
See our latest analysis for SAF-Holland
How Do I Calculate Return On Equity?
The formula for ROE is:
Return on Equity = Net Profit ÷ Shareholders' Equity
Or for SAF-Holland:
14% = €49m ÷ €353m (Based on the trailing twelve months to March 2019.)
It's easy to understand the 'net profit' part of that equation, but 'shareholders' equity' requires further explanation. It is all the money paid into the company from shareholders, plus any earnings retained. You can calculate shareholders' equity by subtracting the company's total liabilities from its total assets.
What Does ROE Signify?
Return on Equity measures a company's profitability against the profit it has kept for the business (plus any capital injections). The 'return' is the amount earned after tax over the last twelve months. A higher profit will lead to a higher ROE. So, all else equal, investors should like a high ROE. That means ROE can be used to compare two businesses.
Does SAF-Holland Have A Good Return On Equity?
By comparing a company's ROE with its industry average, we can get a quick measure of how good it is. Importantly, this is far from a perfect measure, because companies differ significantly within the same industry classification. As is clear from the image below, SAF-Holland has a better ROE than the average (9.4%) in the Auto Components industry.
That is a good sign. In my book, a high ROE almost always warrants a closer look. For example, I often check if insiders have been buying shares .
The Importance Of Debt To Return On Equity
Most companies need money -- from somewhere -- to grow their profits. The cash for investment can come from prior year profits (retained earnings), issuing new shares, or borrowing. In the case of the first and second options, the ROE will reflect this use of cash, for growth. In the latter case, the debt required for growth will boost returns, but will not impact the shareholders' equity. Thus the use of debt can improve ROE, albeit along with extra risk in the case of stormy weather, metaphorically speaking.
Combining SAF-Holland's Debt And Its 14% Return On Equity
It's worth noting the significant use of debt by SAF-Holland, leading to its debt to equity ratio of 1.10. Its ROE is quite good but, it would have probably been lower without the use of debt. Debt increases risk and reduces options for the company in the future, so you generally want to see some good returns from using it.
The Key Takeaway
Return on equity is a useful indicator of the ability of a business to generate profits and return them to shareholders. Companies that can achieve high returns on equity without too much debt are generally of good quality. All else being equal, a higher ROE is better.
But ROE is just one piece of a bigger puzzle, since high quality businesses often trade on high multiples of earnings. The rate at which profits are likely to grow, relative to the expectations of profit growth reflected in the current price, must be considered, too. So you might want to check this FREE visualization of analyst forecasts for the company.
Of course, you might find a fantastic investment by looking elsewhere. So take a peek at this free list of interesting companies.
We aim to bring you long-term focused research analysis driven by fundamental data. Note that our analysis may not factor in the latest price-sensitive company announcements or qualitative material.
If you spot an error that warrants correction, please contact the editor at editorial-team@simplywallst.com. This article by Simply Wall St is general in nature. It does not constitute a recommendation to buy or sell any stock, and does not take account of your objectives, or your financial situation. Simply Wall St has no position in the stocks mentioned. Thank you for reading.
About DB:SFQ
SAF-Holland
Manufactures and sells chassis-related assemblies and components for trailers, trucks, semi-trailers, and buses.
Excellent balance sheet established dividend payer.
Similar Companies
Market Insights


Advertisement
Community Narratives
For the Emperor: Why Games Workshop Could Be a Star Investment
Fair Value UK£160.00|0.4% undervalued
RO
Community Contributor
Securitas will boost margins with AI and tech-driven services
Fair Value SEK 260.91|45.0% undervalued
UN
Community Contributor
A Leader in EV Charging with Growth Potential
Fair Value €27.00|20.4% undervalued
TI
Community Contributor