
Advertisement
Today we'll evaluate E4U a.s. (SEP:EFORU) to determine whether it could have potential as an investment idea. Specifically, we're going to calculate its Return On Capital Employed (ROCE), in the hopes of getting some insight into the business.
Firstly, we'll go over how we calculate ROCE. Then we'll compare its ROCE to similar companies. And finally, we'll look at how its current liabilities are impacting its ROCE.
Return On Capital Employed (ROCE): What is it?
ROCE is a measure of a company's yearly pre-tax profit (its return), relative to the capital employed in the business. In general, businesses with a higher ROCE are usually better quality. In brief, it is a useful tool, but it is not without drawbacks. Author Edwin Whiting says to be careful when comparing the ROCE of different businesses, since 'No two businesses are exactly alike.
So, How Do We Calculate ROCE?
Analysts use this formula to calculate return on capital employed:
Return on Capital Employed = Earnings Before Interest and Tax (EBIT) ÷ (Total Assets - Current Liabilities)
Or for E4U:
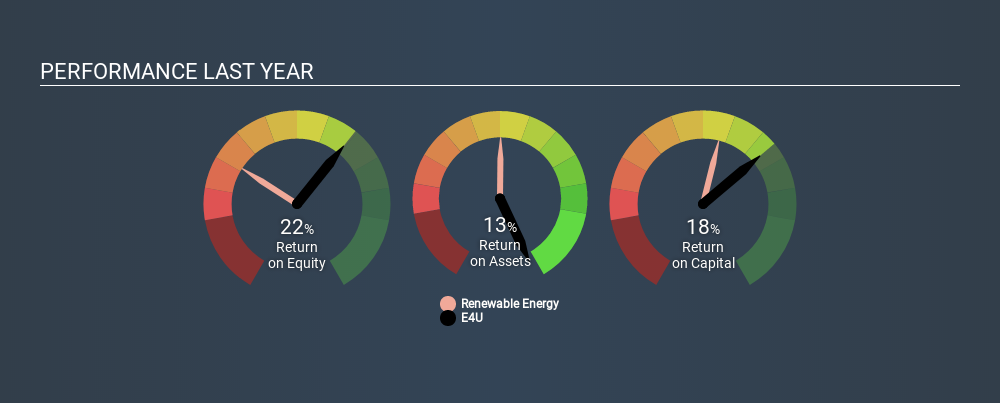
0.18 = Kč55m ÷ (Kč352m - Kč44m) (Based on the trailing twelve months to June 2019.)
So, E4U has an ROCE of 18%.
See our latest analysis for E4U
Is E4U's ROCE Good?
When making comparisons between similar businesses, investors may find ROCE useful. In our analysis, E4U's ROCE is meaningfully higher than the 5.3% average in the Renewable Energy industry. We would consider this a positive, as it suggests it is using capital more effectively than other similar companies. Separate from E4U's performance relative to its industry, its ROCE in absolute terms looks satisfactory, and it may be worth researching in more depth.
Our data shows that E4U currently has an ROCE of 18%, compared to its ROCE of 14% 3 years ago. This makes us wonder if the company is improving. You can click on the image below to see (in greater detail) how E4U's past growth compares to other companies.
When considering ROCE, bear in mind that it reflects the past and does not necessarily predict the future. ROCE can be misleading for companies in cyclical industries, with returns looking impressive during the boom times, but very weak during the busts. This is because ROCE only looks at one year, instead of considering returns across a whole cycle. How cyclical is E4U? You can see for yourself by looking at this free graph of past earnings, revenue and cash flow.
E4U's Current Liabilities And Their Impact On Its ROCE
Current liabilities include invoices, such as supplier payments, short-term debt, or a tax bill, that need to be paid within 12 months. Due to the way the ROCE equation works, having large bills due in the near term can make it look as though a company has less capital employed, and thus a higher ROCE than usual. To counteract this, we check if a company has high current liabilities, relative to its total assets.
E4U has total assets of Kč352m and current liabilities of Kč44m. As a result, its current liabilities are equal to approximately 13% of its total assets. Low current liabilities are not boosting the ROCE too much.
What We Can Learn From E4U's ROCE
Overall, E4U has a decent ROCE and could be worthy of further research. E4U looks strong on this analysis, but there are plenty of other companies that could be a good opportunity . Here is a free list of companies growing earnings rapidly.
If you like to buy stocks alongside management, then you might just love this free list of companies. (Hint: insiders have been buying them).
If you spot an error that warrants correction, please contact the editor at editorial-team@simplywallst.com. This article by Simply Wall St is general in nature. It does not constitute a recommendation to buy or sell any stock, and does not take account of your objectives, or your financial situation. Simply Wall St has no position in the stocks mentioned.
We aim to bring you long-term focused research analysis driven by fundamental data. Note that our analysis may not factor in the latest price-sensitive company announcements or qualitative material. Thank you for reading.
About SEP:EFORU
E4U
Invests in and operates plants that generate energy from renewable sources in the Czech Republic.
Flawless balance sheet with solid track record and pays a dividend.
Market Insights


Advertisement
Community Narratives
The Future of Drug Testing? Fingerprint Tech Shows Serious Promise
Fair Value US$2.98|40.3% undervalued
JO
Community Contributor
Suncorp’s Next Chapter: Insurance-Only and Ready to Grow
Fair Value AU$22.83|7.9% undervalued
RO
Community Contributor
Thyssenkrupp Nucera Will Achieve Double-Digit Profits by 2030 Boosted by Hydrogen Growth
Fair Value €14.40|31.6% undervalued
CH
Community Contributor
Tesla’s Nvidia Moment – The AI & Robotics Inflection Point
Fair Value US$359.72|12.3% undervalued
BL
Community Contributor