- Czech Republic
- /
- Electric Utilities
- /
- SEP:CEZ
CEZ a. s' (SEP:CEZ) investors will be pleased with their impressive 162% return over the last five years


When we invest, we're generally looking for stocks that outperform the market average. And in our experience, buying the right stocks can give your wealth a significant boost. For example, long term CEZ, a. s. (SEP:CEZ) shareholders have enjoyed a 73% share price rise over the last half decade, well in excess of the market return of around 38% (not including dividends). However, more recent returns haven't been as impressive as that, with the stock returning just 4.8% in the last year, including dividends.
With that in mind, it's worth seeing if the company's underlying fundamentals have been the driver of long term performance, or if there are some discrepancies.
View our latest analysis for CEZ a. s
In his essay The Superinvestors of Graham-and-Doddsville Warren Buffett described how share prices do not always rationally reflect the value of a business. One imperfect but simple way to consider how the market perception of a company has shifted is to compare the change in the earnings per share (EPS) with the share price movement.
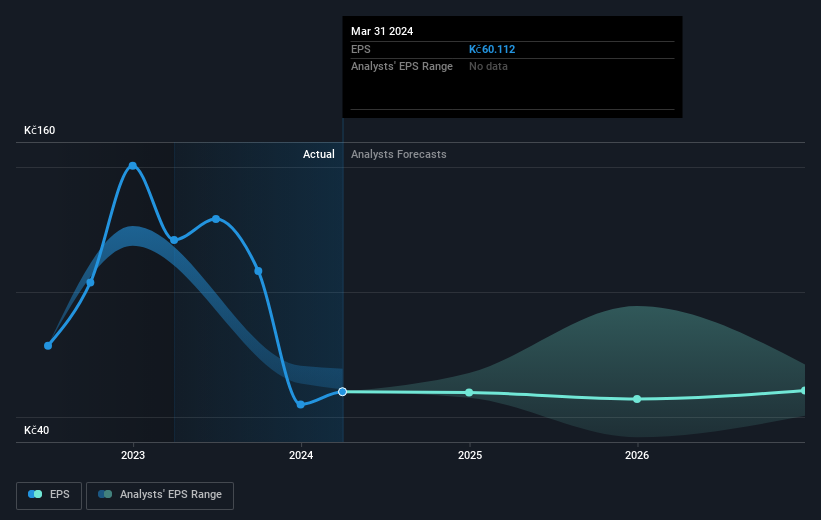
During five years of share price growth, CEZ a. s achieved compound earnings per share (EPS) growth of 20% per year. The EPS growth is more impressive than the yearly share price gain of 12% over the same period. So it seems the market isn't so enthusiastic about the stock these days.
You can see below how EPS has changed over time (discover the exact values by clicking on the image).
It is of course excellent to see how CEZ a. s has grown profits over the years, but the future is more important for shareholders. It might be well worthwhile taking a look at our free report on how its financial position has changed over time.
What About Dividends?
It is important to consider the total shareholder return, as well as the share price return, for any given stock. The TSR incorporates the value of any spin-offs or discounted capital raisings, along with any dividends, based on the assumption that the dividends are reinvested. So for companies that pay a generous dividend, the TSR is often a lot higher than the share price return. In the case of CEZ a. s, it has a TSR of 162% for the last 5 years. That exceeds its share price return that we previously mentioned. This is largely a result of its dividend payments!
A Different Perspective
CEZ a. s shareholders are up 4.8% for the year (even including dividends). But that was short of the market average. If we look back over five years, the returns are even better, coming in at 21% per year for five years. It may well be that this is a business worth popping on the watching, given the continuing positive reception, over time, from the market. It's always interesting to track share price performance over the longer term. But to understand CEZ a. s better, we need to consider many other factors. Case in point: We've spotted 3 warning signs for CEZ a. s you should be aware of.
If you are like me, then you will not want to miss this free list of undervalued small caps that insiders are buying.
Please note, the market returns quoted in this article reflect the market weighted average returns of stocks that currently trade on Czech exchanges.
New: AI Stock Screener & Alerts
Our new AI Stock Screener scans the market every day to uncover opportunities.
• Dividend Powerhouses (3%+ Yield)
• Undervalued Small Caps with Insider Buying
• High growth Tech and AI Companies
Or build your own from over 50 metrics.
Have feedback on this article? Concerned about the content? Get in touch with us directly. Alternatively, email editorial-team (at) simplywallst.com.
This article by Simply Wall St is general in nature. We provide commentary based on historical data and analyst forecasts only using an unbiased methodology and our articles are not intended to be financial advice. It does not constitute a recommendation to buy or sell any stock, and does not take account of your objectives, or your financial situation. We aim to bring you long-term focused analysis driven by fundamental data. Note that our analysis may not factor in the latest price-sensitive company announcements or qualitative material. Simply Wall St has no position in any stocks mentioned.
Have feedback on this article? Concerned about the content? Get in touch with us directly. Alternatively, email editorial-team@simplywallst.com
About SEP:CEZ
CEZ a. s
Engages in the generation, distribution, trade, and sale of electricity and heat in Western, Central, and Southeastern Europe.
Fair value with mediocre balance sheet.

