- China
- /
- Renewable Energy
- /
- SHSE:600868
Guangdong Meiyanjixiang Hydropower Co.,Ltd. (SHSE:600868) Shares Slammed 25% But Getting In Cheap Might Be Difficult Regardless
To the annoyance of some shareholders, Guangdong Meiyanjixiang Hydropower Co.,Ltd. (SHSE:600868) shares are down a considerable 25% in the last month, which continues a horrid run for the company. Instead of being rewarded, shareholders who have already held through the last twelve months are now sitting on a 40% share price drop.
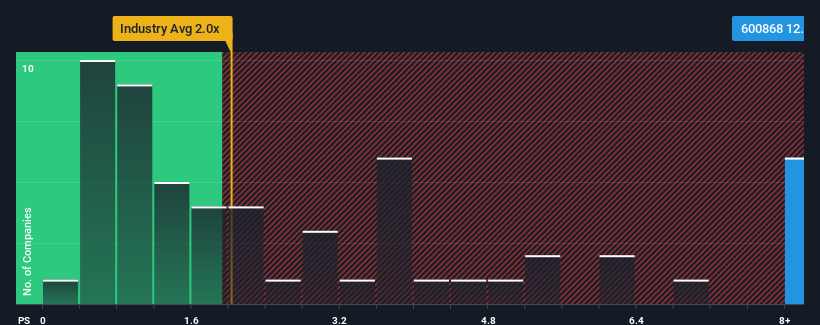
Even after such a large drop in price, when almost half of the companies in China's Renewable Energy industry have price-to-sales ratios (or "P/S") below 2x, you may still consider Guangdong Meiyanjixiang HydropowerLtd as a stock not worth researching with its 12x P/S ratio. However, the P/S might be quite high for a reason and it requires further investigation to determine if it's justified.
View our latest analysis for Guangdong Meiyanjixiang HydropowerLtd

What Does Guangdong Meiyanjixiang HydropowerLtd's P/S Mean For Shareholders?
As an illustration, revenue has deteriorated at Guangdong Meiyanjixiang HydropowerLtd over the last year, which is not ideal at all. Perhaps the market believes the company can do enough to outperform the rest of the industry in the near future, which is keeping the P/S ratio high. However, if this isn't the case, investors might get caught out paying too much for the stock.
Want the full picture on earnings, revenue and cash flow for the company? Then our free report on Guangdong Meiyanjixiang HydropowerLtd will help you shine a light on its historical performance.How Is Guangdong Meiyanjixiang HydropowerLtd's Revenue Growth Trending?
The only time you'd be truly comfortable seeing a P/S as steep as Guangdong Meiyanjixiang HydropowerLtd's is when the company's growth is on track to outshine the industry decidedly.
In reviewing the last year of financials, we were disheartened to see the company's revenues fell to the tune of 48%. Still, the latest three year period has seen an excellent 54% overall rise in revenue, in spite of its unsatisfying short-term performance. So we can start by confirming that the company has generally done a very good job of growing revenue over that time, even though it had some hiccups along the way.
When compared to the industry's one-year growth forecast of 11%, the most recent medium-term revenue trajectory is noticeably more alluring
With this information, we can see why Guangdong Meiyanjixiang HydropowerLtd is trading at such a high P/S compared to the industry. Presumably shareholders aren't keen to offload something they believe will continue to outmanoeuvre the wider industry.
The Final Word
Even after such a strong price drop, Guangdong Meiyanjixiang HydropowerLtd's P/S still exceeds the industry median significantly. Generally, our preference is to limit the use of the price-to-sales ratio to establishing what the market thinks about the overall health of a company.
It's no surprise that Guangdong Meiyanjixiang HydropowerLtd can support its high P/S given the strong revenue growth its experienced over the last three-year is superior to the current industry outlook. In the eyes of shareholders, the probability of a continued growth trajectory is great enough to prevent the P/S from pulling back. Barring any significant changes to the company's ability to make money, the share price should continue to be propped up.
Having said that, be aware Guangdong Meiyanjixiang HydropowerLtd is showing 1 warning sign in our investment analysis, you should know about.
Of course, profitable companies with a history of great earnings growth are generally safer bets. So you may wish to see this free collection of other companies that have reasonable P/E ratios and have grown earnings strongly.
New: Manage All Your Stock Portfolios in One Place
We've created the ultimate portfolio companion for stock investors, and it's free.
• Connect an unlimited number of Portfolios and see your total in one currency
• Be alerted to new Warning Signs or Risks via email or mobile
• Track the Fair Value of your stocks
Have feedback on this article? Concerned about the content? Get in touch with us directly. Alternatively, email editorial-team (at) simplywallst.com.
This article by Simply Wall St is general in nature. We provide commentary based on historical data and analyst forecasts only using an unbiased methodology and our articles are not intended to be financial advice. It does not constitute a recommendation to buy or sell any stock, and does not take account of your objectives, or your financial situation. We aim to bring you long-term focused analysis driven by fundamental data. Note that our analysis may not factor in the latest price-sensitive company announcements or qualitative material. Simply Wall St has no position in any stocks mentioned.
Have feedback on this article? Concerned about the content? Get in touch with us directly. Alternatively, email editorial-team@simplywallst.com
About SHSE:600868
Guangdong Meiyanjixiang HydropowerLtd
Guangdong Meiyanjixiang Hydropower Co.,Ltd.
Mediocre balance sheet with minimal risk.
Market Insights
Community Narratives


