- China
- /
- Electric Utilities
- /
- SHSE:600396
We Like These Underlying Return On Capital Trends At Huadian Liaoning Energy DevelopmentLtd (SHSE:600396)


Finding a business that has the potential to grow substantially is not easy, but it is possible if we look at a few key financial metrics. Amongst other things, we'll want to see two things; firstly, a growing return on capital employed (ROCE) and secondly, an expansion in the company's amount of capital employed. This shows us that it's a compounding machine, able to continually reinvest its earnings back into the business and generate higher returns. Speaking of which, we noticed some great changes in Huadian Liaoning Energy DevelopmentLtd's (SHSE:600396) returns on capital, so let's have a look.
What Is Return On Capital Employed (ROCE)?
For those that aren't sure what ROCE is, it measures the amount of pre-tax profits a company can generate from the capital employed in its business. To calculate this metric for Huadian Liaoning Energy DevelopmentLtd, this is the formula:
Return on Capital Employed = Earnings Before Interest and Tax (EBIT) ÷ (Total Assets - Current Liabilities)
0.017 = CN¥107m ÷ (CN¥14b - CN¥7.2b) (Based on the trailing twelve months to March 2024).
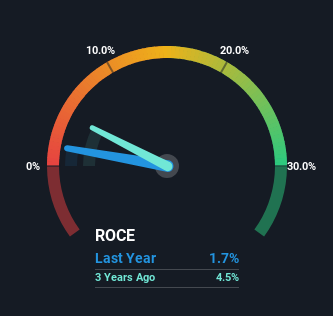
Therefore, Huadian Liaoning Energy DevelopmentLtd has an ROCE of 1.7%. Ultimately, that's a low return and it under-performs the Electric Utilities industry average of 4.5%.
See our latest analysis for Huadian Liaoning Energy DevelopmentLtd
While the past is not representative of the future, it can be helpful to know how a company has performed historically, which is why we have this chart above. If you're interested in investigating Huadian Liaoning Energy DevelopmentLtd's past further, check out this free graph covering Huadian Liaoning Energy DevelopmentLtd's past earnings, revenue and cash flow.
What The Trend Of ROCE Can Tell Us
It's great to see that Huadian Liaoning Energy DevelopmentLtd has started to generate some pre-tax earnings from prior investments. Historically the company was generating losses but as we can see from the latest figures referenced above, they're now earning 1.7% on their capital employed. Additionally, the business is utilizing 27% less capital than it was five years ago, and taken at face value, that can mean the company needs less funds at work to get a return. The reduction could indicate that the company is selling some assets, and considering returns are up, they appear to be selling the right ones.
On a separate but related note, it's important to know that Huadian Liaoning Energy DevelopmentLtd has a current liabilities to total assets ratio of 53%, which we'd consider pretty high. This can bring about some risks because the company is basically operating with a rather large reliance on its suppliers or other sorts of short-term creditors. While it's not necessarily a bad thing, it can be beneficial if this ratio is lower.
In Conclusion...
In a nutshell, we're pleased to see that Huadian Liaoning Energy DevelopmentLtd has been able to generate higher returns from less capital. And with a respectable 45% awarded to those who held the stock over the last five years, you could argue that these developments are starting to get the attention they deserve. With that being said, we still think the promising fundamentals mean the company deserves some further due diligence.
If you want to know some of the risks facing Huadian Liaoning Energy DevelopmentLtd we've found 2 warning signs (1 is a bit unpleasant!) that you should be aware of before investing here.
While Huadian Liaoning Energy DevelopmentLtd may not currently earn the highest returns, we've compiled a list of companies that currently earn more than 25% return on equity. Check out this free list here.
Valuation is complex, but we're here to simplify it.
Discover if Huadian Liaoning Energy DevelopmentLtd might be undervalued or overvalued with our detailed analysis, featuring fair value estimates, potential risks, dividends, insider trades, and its financial condition.
Access Free AnalysisHave feedback on this article? Concerned about the content? Get in touch with us directly. Alternatively, email editorial-team (at) simplywallst.com.
This article by Simply Wall St is general in nature. We provide commentary based on historical data and analyst forecasts only using an unbiased methodology and our articles are not intended to be financial advice. It does not constitute a recommendation to buy or sell any stock, and does not take account of your objectives, or your financial situation. We aim to bring you long-term focused analysis driven by fundamental data. Note that our analysis may not factor in the latest price-sensitive company announcements or qualitative material. Simply Wall St has no position in any stocks mentioned.
Have feedback on this article? Concerned about the content? Get in touch with us directly. Alternatively, email editorial-team@simplywallst.com
About SHSE:600396
Huadian Liaoning Energy DevelopmentLtd
Produces and sells electricity and heat in the Liaoning and Inner Mongolia regions of China.
Good value with imperfect balance sheet.
Market Insights

Community Narratives


