
Advertisement
- China
- /
- Renewable Energy
- /
- SHSE:600021
A Look At The Intrinsic Value Of Shanghai Electric Power Co., Ltd. (SHSE:600021)
Key Insights
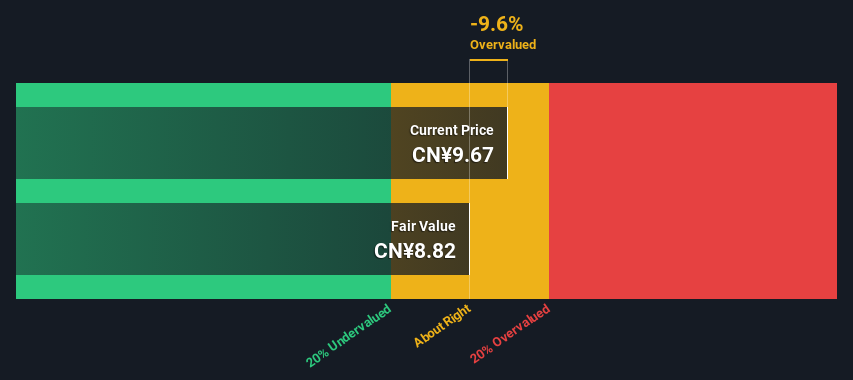
- Using the 2 Stage Free Cash Flow to Equity, Shanghai Electric Power fair value estimate is CN¥8.82
- Current share price of CN¥9.67 suggests Shanghai Electric Power is potentially trading close to its fair value
- Industry average of 1,564% suggests Shanghai Electric Power's peers are currently trading at a higher premium to fair value
Today we will run through one way of estimating the intrinsic value of Shanghai Electric Power Co., Ltd. (SHSE:600021) by taking the expected future cash flows and discounting them to today's value. We will take advantage of the Discounted Cash Flow (DCF) model for this purpose. Believe it or not, it's not too difficult to follow, as you'll see from our example!
Companies can be valued in a lot of ways, so we would point out that a DCF is not perfect for every situation. If you still have some burning questions about this type of valuation, take a look at the Simply Wall St analysis model.
Check out our latest analysis for Shanghai Electric Power
Is Shanghai Electric Power Fairly Valued?
We are going to use a two-stage DCF model, which, as the name states, takes into account two stages of growth. The first stage is generally a higher growth period which levels off heading towards the terminal value, captured in the second 'steady growth' period. In the first stage we need to estimate the cash flows to the business over the next ten years. Where possible we use analyst estimates, but when these aren't available we extrapolate the previous free cash flow (FCF) from the last estimate or reported value. We assume companies with shrinking free cash flow will slow their rate of shrinkage, and that companies with growing free cash flow will see their growth rate slow, over this period. We do this to reflect that growth tends to slow more in the early years than it does in later years.
Generally we assume that a dollar today is more valuable than a dollar in the future, and so the sum of these future cash flows is then discounted to today's value:
10-year free cash flow (FCF) forecast
| 2025 | 2026 | 2027 | 2028 | 2029 | 2030 | 2031 | 2032 | 2033 | 2034 | |
| Levered FCF (CN¥, Millions) | CN¥5.16b | CN¥3.72b | CN¥2.98b | CN¥2.59b | CN¥2.37b | CN¥2.25b | CN¥2.20b | CN¥2.17b | CN¥2.18b | CN¥2.20b |
| Growth Rate Estimate Source | Analyst x1 | Analyst x1 | Est @ -19.97% | Est @ -13.12% | Est @ -8.33% | Est @ -4.98% | Est @ -2.63% | Est @ -0.99% | Est @ 0.17% | Est @ 0.97% |
| Present Value (CN¥, Millions) Discounted @ 12% | CN¥4.6k | CN¥3.0k | CN¥2.1k | CN¥1.6k | CN¥1.3k | CN¥1.1k | CN¥985 | CN¥869 | CN¥777 | CN¥699 |
("Est" = FCF growth rate estimated by Simply Wall St)
Present Value of 10-year Cash Flow (PVCF) = CN¥17b
We now need to calculate the Terminal Value, which accounts for all the future cash flows after this ten year period. The Gordon Growth formula is used to calculate Terminal Value at a future annual growth rate equal to the 5-year average of the 10-year government bond yield of 2.9%. We discount the terminal cash flows to today's value at a cost of equity of 12%.
Terminal Value (TV)= FCF2034 × (1 + g) ÷ (r – g) = CN¥2.2b× (1 + 2.9%) ÷ (12%– 2.9%) = CN¥24b
Present Value of Terminal Value (PVTV)= TV / (1 + r)10= CN¥24b÷ ( 1 + 12%)10= CN¥7.7b
The total value, or equity value, is then the sum of the present value of the future cash flows, which in this case is CN¥25b. In the final step we divide the equity value by the number of shares outstanding. Relative to the current share price of CN¥9.7, the company appears around fair value at the time of writing. Valuations are imprecise instruments though, rather like a telescope - move a few degrees and end up in a different galaxy. Do keep this in mind.
The Assumptions
The calculation above is very dependent on two assumptions. The first is the discount rate and the other is the cash flows. Part of investing is coming up with your own evaluation of a company's future performance, so try the calculation yourself and check your own assumptions. The DCF also does not consider the possible cyclicality of an industry, or a company's future capital requirements, so it does not give a full picture of a company's potential performance. Given that we are looking at Shanghai Electric Power as potential shareholders, the cost of equity is used as the discount rate, rather than the cost of capital (or weighted average cost of capital, WACC) which accounts for debt. In this calculation we've used 12%, which is based on a levered beta of 1.865. Beta is a measure of a stock's volatility, compared to the market as a whole. We get our beta from the industry average beta of globally comparable companies, with an imposed limit between 0.8 and 2.0, which is a reasonable range for a stable business.
SWOT Analysis for Shanghai Electric Power
Strength
- Earnings growth over the past year exceeded the industry.
- Debt is well covered by earnings.
Weakness
- Dividend is low compared to the top 25% of dividend payers in the Renewable Energy market.
Opportunity
- Annual earnings are forecast to grow for the next 3 years.
- Good value based on P/E ratio compared to estimated Fair P/E ratio.
Threat
- Debt is not well covered by operating cash flow.
- Paying a dividend but company has no free cash flows.
Next Steps:
Valuation is only one side of the coin in terms of building your investment thesis, and it is only one of many factors that you need to assess for a company. DCF models are not the be-all and end-all of investment valuation. Rather it should be seen as a guide to "what assumptions need to be true for this stock to be under/overvalued?" For example, changes in the company's cost of equity or the risk free rate can significantly impact the valuation. For Shanghai Electric Power, we've compiled three additional factors you should look at:
- Risks: For instance, we've identified 2 warning signs for Shanghai Electric Power (1 makes us a bit uncomfortable) you should be aware of.
- Future Earnings: How does 600021's growth rate compare to its peers and the wider market? Dig deeper into the analyst consensus number for the upcoming years by interacting with our free analyst growth expectation chart.
- Other Solid Businesses: Low debt, high returns on equity and good past performance are fundamental to a strong business. Why not explore our interactive list of stocks with solid business fundamentals to see if there are other companies you may not have considered!
PS. The Simply Wall St app conducts a discounted cash flow valuation for every stock on the SHSE every day. If you want to find the calculation for other stocks just search here.
New: Manage All Your Stock Portfolios in One Place
We've created the ultimate portfolio companion for stock investors, and it's free.
• Connect an unlimited number of Portfolios and see your total in one currency
• Be alerted to new Warning Signs or Risks via email or mobile
• Track the Fair Value of your stocks
Have feedback on this article? Concerned about the content? Get in touch with us directly. Alternatively, email editorial-team (at) simplywallst.com.
This article by Simply Wall St is general in nature. We provide commentary based on historical data and analyst forecasts only using an unbiased methodology and our articles are not intended to be financial advice. It does not constitute a recommendation to buy or sell any stock, and does not take account of your objectives, or your financial situation. We aim to bring you long-term focused analysis driven by fundamental data. Note that our analysis may not factor in the latest price-sensitive company announcements or qualitative material. Simply Wall St has no position in any stocks mentioned.
About SHSE:600021
Shanghai Electric Power
Engages in the integration of clean energy, new energy, smart energy technology research and development and application, modern energy supply, and services in China and internationally.
Proven track record second-rate dividend payer.
Similar Companies
Market Insights

Advertisement
Community Narratives
The Next Phase of Energy Storage: How NeoVolta Is Tackling America’s Power Crunch
Fair Value US$7.50|30.4% undervalued
MA
Community Contributor
Why EnSilica is Worth Possibly 13x its Current Price
Fair Value UK£5.00|89.5% undervalued
DO
Community Contributor
M&A Activity, Industry Diversification & A Defense Contract Monopoly Will Push BWXT For Healthy Long-Term Growth
Fair Value US$220.00|13.0% undervalued
CL
Community Contributor
A case for Cassiar Gold Corp (TSXV: GLDC) to reach CAD$8-10 before 2030 (X30-37)
Fair Value CA$10.00|96.5% undervalued
AG
Community Contributor