
Advertisement
- China
- /
- Transportation
- /
- SHSE:603776
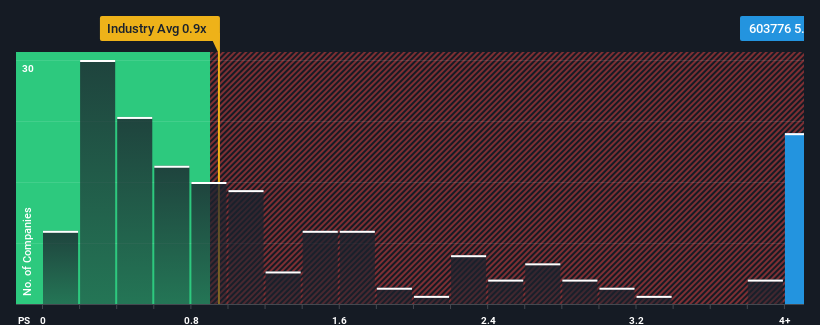
Optimistic Investors Push Youon Technology Co.,Ltd (SHSE:603776) Shares Up 26% But Growth Is Lacking

Youon Technology Co.,Ltd (SHSE:603776) shares have had a really impressive month, gaining 26% after a shaky period beforehand. Not all shareholders will be feeling jubilant, since the share price is still down a very disappointing 16% in the last twelve months.
Since its price has surged higher, given around half the companies in China's Transportation industry have price-to-sales ratios (or "P/S") below 2.5x, you may consider Youon TechnologyLtd as a stock to avoid entirely with its 5.3x P/S ratio. However, the P/S might be quite high for a reason and it requires further investigation to determine if it's justified.
Check out our latest analysis for Youon TechnologyLtd
What Does Youon TechnologyLtd's P/S Mean For Shareholders?
For example, consider that Youon TechnologyLtd's financial performance has been poor lately as its revenue has been in decline. Perhaps the market believes the company can do enough to outperform the rest of the industry in the near future, which is keeping the P/S ratio high. If not, then existing shareholders may be quite nervous about the viability of the share price.
Although there are no analyst estimates available for Youon TechnologyLtd, take a look at this free data-rich visualisation to see how the company stacks up on earnings, revenue and cash flow.Do Revenue Forecasts Match The High P/S Ratio?
Youon TechnologyLtd's P/S ratio would be typical for a company that's expected to deliver very strong growth, and importantly, perform much better than the industry.
Retrospectively, the last year delivered a frustrating 16% decrease to the company's top line. The last three years don't look nice either as the company has shrunk revenue by 41% in aggregate. Accordingly, shareholders would have felt downbeat about the medium-term rates of revenue growth.
In contrast to the company, the rest of the industry is expected to grow by 7.2% over the next year, which really puts the company's recent medium-term revenue decline into perspective.
With this in mind, we find it worrying that Youon TechnologyLtd's P/S exceeds that of its industry peers. Apparently many investors in the company are way more bullish than recent times would indicate and aren't willing to let go of their stock at any price. Only the boldest would assume these prices are sustainable as a continuation of recent revenue trends is likely to weigh heavily on the share price eventually.
What We Can Learn From Youon TechnologyLtd's P/S?
The strong share price surge has lead to Youon TechnologyLtd's P/S soaring as well. Generally, our preference is to limit the use of the price-to-sales ratio to establishing what the market thinks about the overall health of a company.
We've established that Youon TechnologyLtd currently trades on a much higher than expected P/S since its recent revenues have been in decline over the medium-term. With a revenue decline on investors' minds, the likelihood of a souring sentiment is quite high which could send the P/S back in line with what we'd expect. Unless the recent medium-term conditions improve markedly, investors will have a hard time accepting the share price as fair value.
You need to take note of risks, for example - Youon TechnologyLtd has 3 warning signs (and 1 which can't be ignored) we think you should know about.
Of course, profitable companies with a history of great earnings growth are generally safer bets. So you may wish to see this free collection of other companies that have reasonable P/E ratios and have grown earnings strongly.
New: Manage All Your Stock Portfolios in One Place
We've created the ultimate portfolio companion for stock investors, and it's free.
• Connect an unlimited number of Portfolios and see your total in one currency
• Be alerted to new Warning Signs or Risks via email or mobile
• Track the Fair Value of your stocks
Have feedback on this article? Concerned about the content? Get in touch with us directly. Alternatively, email editorial-team (at) simplywallst.com.
This article by Simply Wall St is general in nature. We provide commentary based on historical data and analyst forecasts only using an unbiased methodology and our articles are not intended to be financial advice. It does not constitute a recommendation to buy or sell any stock, and does not take account of your objectives, or your financial situation. We aim to bring you long-term focused analysis driven by fundamental data. Note that our analysis may not factor in the latest price-sensitive company announcements or qualitative material. Simply Wall St has no position in any stocks mentioned.
Have feedback on this article? Concerned about the content? Get in touch with us directly. Alternatively, email editorial-team@simplywallst.com
About SHSE:603776
Youon TechnologyLtd
Engages in the research and development, sale, construction, and operation services based on the Internet of Things and data cloud technology, hydrogen energy, and data platform business in China and internationally.
Adequate balance sheet low.
Market Insights

Advertisement
Community Narratives
Groundbreaking therapies that could change the treatment landscape for PTSD, fibromyalgia, MS & Alzheimer’s
Fair Value US$6.20|86.9% undervalued
CM
Community Contributor
DigitalOcean Will Grow 14% by Embracing AI with Paperspace Acquisition
Fair Value US$50.00|41.7% undervalued
NE
Community Contributor
Viant Technology: A Rising AdTech Challenger in the AI-Powered CTV Market
Fair Value US$38.61|63.2% undervalued
BL
Community Contributor
Volvo will Accelerate Forward into Electric and Autonomous Leadership in Five Years
Fair Value SEK 438.80|39.7% undervalued
UN
Community Contributor