
Advertisement
- China
- /
- Telecom Services and Carriers
- /
- SZSE:300560
A Piece Of The Puzzle Missing From Zhong Fu Tong Group Co., Ltd.'s (SZSE:300560) 26% Share Price Climb
The Zhong Fu Tong Group Co., Ltd. (SZSE:300560) share price has done very well over the last month, posting an excellent gain of 26%. Not all shareholders will be feeling jubilant, since the share price is still down a very disappointing 23% in the last twelve months.
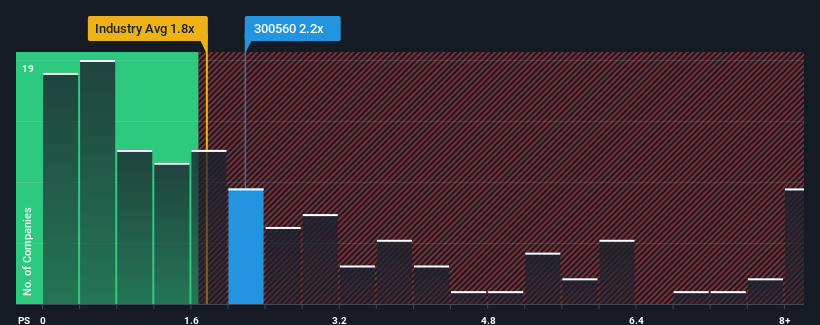
In spite of the firm bounce in price, Zhong Fu Tong Group may still be sending bullish signals at the moment with its price-to-sales (or "P/S") ratio of 2.2x, since almost half of all companies in the Telecom industry in China have P/S ratios greater than 3.2x and even P/S higher than 6x are not unusual. Although, it's not wise to just take the P/S at face value as there may be an explanation why it's limited.
View our latest analysis for Zhong Fu Tong Group
How Zhong Fu Tong Group Has Been Performing
Revenue has risen firmly for Zhong Fu Tong Group recently, which is pleasing to see. Perhaps the market is expecting this acceptable revenue performance to take a dive, which has kept the P/S suppressed. If you like the company, you'd be hoping this isn't the case so that you could potentially pick up some stock while it's out of favour.
We don't have analyst forecasts, but you can see how recent trends are setting up the company for the future by checking out our free report on Zhong Fu Tong Group's earnings, revenue and cash flow.Do Revenue Forecasts Match The Low P/S Ratio?
Zhong Fu Tong Group's P/S ratio would be typical for a company that's only expected to deliver limited growth, and importantly, perform worse than the industry.
Retrospectively, the last year delivered a decent 13% gain to the company's revenues. The latest three year period has also seen an excellent 71% overall rise in revenue, aided somewhat by its short-term performance. Accordingly, shareholders would have definitely welcomed those medium-term rates of revenue growth.
This is in contrast to the rest of the industry, which is expected to grow by 4.4% over the next year, materially lower than the company's recent medium-term annualised growth rates.
With this in mind, we find it intriguing that Zhong Fu Tong Group's P/S isn't as high compared to that of its industry peers. Apparently some shareholders believe the recent performance has exceeded its limits and have been accepting significantly lower selling prices.
What Does Zhong Fu Tong Group's P/S Mean For Investors?
Zhong Fu Tong Group's stock price has surged recently, but its but its P/S still remains modest. Typically, we'd caution against reading too much into price-to-sales ratios when settling on investment decisions, though it can reveal plenty about what other market participants think about the company.
Our examination of Zhong Fu Tong Group revealed its three-year revenue trends aren't boosting its P/S anywhere near as much as we would have predicted, given they look better than current industry expectations. Potential investors that are sceptical over continued revenue performance may be preventing the P/S ratio from matching previous strong performance. At least price risks look to be very low if recent medium-term revenue trends continue, but investors seem to think future revenue could see a lot of volatility.
It's always necessary to consider the ever-present spectre of investment risk. We've identified 2 warning signs with Zhong Fu Tong Group, and understanding these should be part of your investment process.
If companies with solid past earnings growth is up your alley, you may wish to see this free collection of other companies with strong earnings growth and low P/E ratios.
Valuation is complex, but we're here to simplify it.
Discover if Zhong Fu Tong Group might be undervalued or overvalued with our detailed analysis, featuring fair value estimates, potential risks, dividends, insider trades, and its financial condition.
Access Free AnalysisHave feedback on this article? Concerned about the content? Get in touch with us directly. Alternatively, email editorial-team (at) simplywallst.com.
This article by Simply Wall St is general in nature. We provide commentary based on historical data and analyst forecasts only using an unbiased methodology and our articles are not intended to be financial advice. It does not constitute a recommendation to buy or sell any stock, and does not take account of your objectives, or your financial situation. We aim to bring you long-term focused analysis driven by fundamental data. Note that our analysis may not factor in the latest price-sensitive company announcements or qualitative material. Simply Wall St has no position in any stocks mentioned.
About SZSE:300560
Zhong Fu Tong Group
Provides communication network construction, maintenance, and optimization services in China.
Mediocre balance sheet and overvalued.
Market Insights

Advertisement
Community Narratives
Finding The True Value Of A Logistics Powerhouse
Fair Value US$95.21|7.5% undervalued
NV
Community Contributor
Paradigm Biopharmaceuticals Will Lead Osteoarthritis Treatment with Zilosul's FDA Success
Fair Value AU$5.50|93.3% undervalued
AM
Community Contributor
Barrick Mining (ABX:CA): A Gold Hedge against a U.S. Shutdown
Fair Value CA$60.00|26.4% undervalued
GM
Community Contributor