- China
- /
- Electronic Equipment and Components
- /
- SZSE:301391
Colorlight Cloud Tech Ltd's (SZSE:301391) Intrinsic Value Is Potentially 36% Above Its Share Price

Key Insights
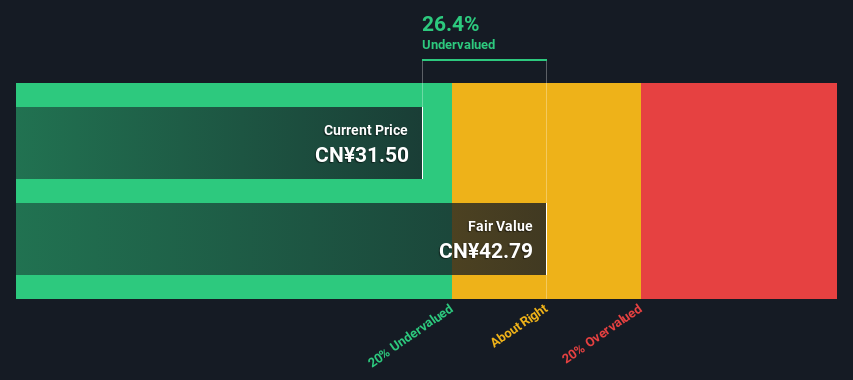
- The projected fair value for Colorlight Cloud Tech is CN¥42.79 based on 2 Stage Free Cash Flow to Equity
- Current share price of CN¥31.50 suggests Colorlight Cloud Tech is potentially 26% undervalued
- Analyst price target for 301391 is CN¥87.48, which is 104% above our fair value estimate
In this article we are going to estimate the intrinsic value of Colorlight Cloud Tech Ltd (SZSE:301391) by taking the forecast future cash flows of the company and discounting them back to today's value. We will use the Discounted Cash Flow (DCF) model on this occasion. Don't get put off by the jargon, the math behind it is actually quite straightforward.
We would caution that there are many ways of valuing a company and, like the DCF, each technique has advantages and disadvantages in certain scenarios. If you still have some burning questions about this type of valuation, take a look at the Simply Wall St analysis model.
View our latest analysis for Colorlight Cloud Tech
Step By Step Through The Calculation
We are going to use a two-stage DCF model, which, as the name states, takes into account two stages of growth. The first stage is generally a higher growth period which levels off heading towards the terminal value, captured in the second 'steady growth' period. To begin with, we have to get estimates of the next ten years of cash flows. Where possible we use analyst estimates, but when these aren't available we extrapolate the previous free cash flow (FCF) from the last estimate or reported value. We assume companies with shrinking free cash flow will slow their rate of shrinkage, and that companies with growing free cash flow will see their growth rate slow, over this period. We do this to reflect that growth tends to slow more in the early years than it does in later years.
Generally we assume that a dollar today is more valuable than a dollar in the future, so we discount the value of these future cash flows to their estimated value in today's dollars:
10-year free cash flow (FCF) forecast
| 2025 | 2026 | 2027 | 2028 | 2029 | 2030 | 2031 | 2032 | 2033 | 2034 | |
| Levered FCF (CN¥, Millions) | CN¥56.0m | CN¥141.0m | CN¥173.9m | CN¥203.8m | CN¥230.1m | CN¥252.8m | CN¥272.5m | CN¥289.6m | CN¥304.9m | CN¥318.7m |
| Growth Rate Estimate Source | Analyst x1 | Analyst x1 | Est @ 23.34% | Est @ 17.19% | Est @ 12.89% | Est @ 9.88% | Est @ 7.77% | Est @ 6.29% | Est @ 5.26% | Est @ 4.54% |
| Present Value (CN¥, Millions) Discounted @ 8.3% | CN¥51.7 | CN¥120 | CN¥137 | CN¥148 | CN¥154 | CN¥156 | CN¥156 | CN¥153 | CN¥148 | CN¥143 |
("Est" = FCF growth rate estimated by Simply Wall St)
Present Value of 10-year Cash Flow (PVCF) = CN¥1.4b
The second stage is also known as Terminal Value, this is the business's cash flow after the first stage. For a number of reasons a very conservative growth rate is used that cannot exceed that of a country's GDP growth. In this case we have used the 5-year average of the 10-year government bond yield (2.9%) to estimate future growth. In the same way as with the 10-year 'growth' period, we discount future cash flows to today's value, using a cost of equity of 8.3%.
Terminal Value (TV)= FCF2034 × (1 + g) ÷ (r – g) = CN¥319m× (1 + 2.9%) ÷ (8.3%– 2.9%) = CN¥6.0b
Present Value of Terminal Value (PVTV)= TV / (1 + r)10= CN¥6.0b÷ ( 1 + 8.3%)10= CN¥2.7b
The total value, or equity value, is then the sum of the present value of the future cash flows, which in this case is CN¥4.0b. In the final step we divide the equity value by the number of shares outstanding. Compared to the current share price of CN¥31.5, the company appears a touch undervalued at a 26% discount to where the stock price trades currently. The assumptions in any calculation have a big impact on the valuation, so it is better to view this as a rough estimate, not precise down to the last cent.
Important Assumptions
We would point out that the most important inputs to a discounted cash flow are the discount rate and of course the actual cash flows. If you don't agree with these result, have a go at the calculation yourself and play with the assumptions. The DCF also does not consider the possible cyclicality of an industry, or a company's future capital requirements, so it does not give a full picture of a company's potential performance. Given that we are looking at Colorlight Cloud Tech as potential shareholders, the cost of equity is used as the discount rate, rather than the cost of capital (or weighted average cost of capital, WACC) which accounts for debt. In this calculation we've used 8.3%, which is based on a levered beta of 1.103. Beta is a measure of a stock's volatility, compared to the market as a whole. We get our beta from the industry average beta of globally comparable companies, with an imposed limit between 0.8 and 2.0, which is a reasonable range for a stable business.
SWOT Analysis for Colorlight Cloud Tech
- Debt is well covered by earnings.
- Earnings declined over the past year.
- Dividend is low compared to the top 25% of dividend payers in the Electronic market.
- Annual earnings are forecast to grow faster than the Chinese market.
- Good value based on P/E ratio and estimated fair value.
- Debt is not well covered by operating cash flow.
- Paying a dividend but company has no free cash flows.
Moving On:
Although the valuation of a company is important, it ideally won't be the sole piece of analysis you scrutinize for a company. The DCF model is not a perfect stock valuation tool. Rather it should be seen as a guide to "what assumptions need to be true for this stock to be under/overvalued?" For instance, if the terminal value growth rate is adjusted slightly, it can dramatically alter the overall result. What is the reason for the share price sitting below the intrinsic value? For Colorlight Cloud Tech, we've put together three fundamental factors you should look at:
- Risks: Be aware that Colorlight Cloud Tech is showing 2 warning signs in our investment analysis , and 1 of those is significant...
- Future Earnings: How does 301391's growth rate compare to its peers and the wider market? Dig deeper into the analyst consensus number for the upcoming years by interacting with our free analyst growth expectation chart.
- Other High Quality Alternatives: Do you like a good all-rounder? Explore our interactive list of high quality stocks to get an idea of what else is out there you may be missing!
PS. The Simply Wall St app conducts a discounted cash flow valuation for every stock on the SZSE every day. If you want to find the calculation for other stocks just search here.
The New Payments ETF Is Live on NASDAQ:
Money is moving to real-time rails, and a newly listed ETF now gives investors direct exposure. Fast settlement. Institutional custody. Simple access.
Explore how this launch could reshape portfolios
Sponsored ContentNew: AI Stock Screener & Alerts
Our new AI Stock Screener scans the market every day to uncover opportunities.
• Dividend Powerhouses (3%+ Yield)
• Undervalued Small Caps with Insider Buying
• High growth Tech and AI Companies
Or build your own from over 50 metrics.
Have feedback on this article? Concerned about the content? Get in touch with us directly. Alternatively, email editorial-team (at) simplywallst.com.
This article by Simply Wall St is general in nature. We provide commentary based on historical data and analyst forecasts only using an unbiased methodology and our articles are not intended to be financial advice. It does not constitute a recommendation to buy or sell any stock, and does not take account of your objectives, or your financial situation. We aim to bring you long-term focused analysis driven by fundamental data. Note that our analysis may not factor in the latest price-sensitive company announcements or qualitative material. Simply Wall St has no position in any stocks mentioned.
About SZSE:301391
Colorlight Cloud Tech
Engages in the research and development, manufacture, and sale of LED display control systems, video processing equipment, play servers, and cloud network players worldwide.
Adequate balance sheet with low risk.
Market Insights

Weekly Picks

Early mover in a fast growing industry. Likely to experience share price volatility as they scale


A case for CA$31.80 (undiluted), aka 8,616% upside from CA$0.37 (an 86 bagger!).


Moderation and Stabilisation: HOLD: Fair Price based on a 4-year Cycle is $12.08
Recently Updated Narratives

Meta’s Bold Bet on AI Pays Off

ADP Stock: Solid Fundamentals, But AI Investments Test Its Margin Resilience

Visa Stock: The Toll Booth at the Center of Global Commerce
Popular Narratives


Crazy Undervalued 42 Baggers Silver Play (Active & Running Mine)


NVDA: Expanding AI Demand Will Drive Major Data Center Investments Through 2026

The AI Infrastructure Giant Grows Into Its Valuation
Trending Discussion


