
Advertisement
- China
- /
- Electronic Equipment and Components
- /
- SZSE:301366
Does The Market Have A Low Tolerance For Shenzhen Edadoc Technology Co.,Ltd.'s (SZSE:301366) Mixed Fundamentals?

It is hard to get excited after looking at Shenzhen Edadoc TechnologyLtd's (SZSE:301366) recent performance, when its stock has declined 10% over the past month. It is possible that the markets have ignored the company's differing financials and decided to lean-in to the negative sentiment. Stock prices are usually driven by a company’s financial performance over the long term, and therefore we decided to pay more attention to the company's financial performance. In this article, we decided to focus on Shenzhen Edadoc TechnologyLtd's ROE.
Return on equity or ROE is an important factor to be considered by a shareholder because it tells them how effectively their capital is being reinvested. Simply put, it is used to assess the profitability of a company in relation to its equity capital.
Check out our latest analysis for Shenzhen Edadoc TechnologyLtd
How To Calculate Return On Equity?
The formula for return on equity is:
Return on Equity = Net Profit (from continuing operations) ÷ Shareholders' Equity
So, based on the above formula, the ROE for Shenzhen Edadoc TechnologyLtd is:
4.1% = CN¥92m ÷ CN¥2.3b (Based on the trailing twelve months to March 2024).
The 'return' is the amount earned after tax over the last twelve months. Another way to think of that is that for every CN¥1 worth of equity, the company was able to earn CN¥0.04 in profit.
What Is The Relationship Between ROE And Earnings Growth?
So far, we've learned that ROE is a measure of a company's profitability. Depending on how much of these profits the company reinvests or "retains", and how effectively it does so, we are then able to assess a company’s earnings growth potential. Generally speaking, other things being equal, firms with a high return on equity and profit retention, have a higher growth rate than firms that don’t share these attributes.
Shenzhen Edadoc TechnologyLtd's Earnings Growth And 4.1% ROE
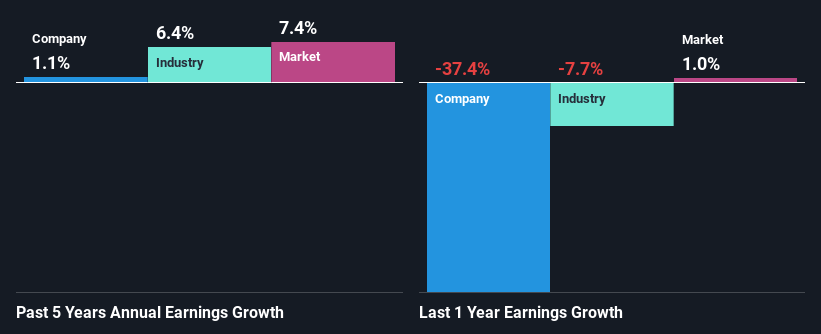
It is quite clear that Shenzhen Edadoc TechnologyLtd's ROE is rather low. Even compared to the average industry ROE of 6.3%, the company's ROE is quite dismal. As a result, Shenzhen Edadoc TechnologyLtd's flat earnings over the past five years doesn't come as a surprise given its lower ROE.
Next, on comparing with the industry net income growth, we found that Shenzhen Edadoc TechnologyLtd's reported growth was lower than the industry growth of 6.4% over the last few years, which is not something we like to see.
Earnings growth is an important metric to consider when valuing a stock. What investors need to determine next is if the expected earnings growth, or the lack of it, is already built into the share price. This then helps them determine if the stock is placed for a bright or bleak future. Is Shenzhen Edadoc TechnologyLtd fairly valued compared to other companies? These 3 valuation measures might help you decide.
Is Shenzhen Edadoc TechnologyLtd Using Its Retained Earnings Effectively?
Despite having a moderate three-year median payout ratio of 34% (meaning the company retains66% of profits) in the last three-year period, Shenzhen Edadoc TechnologyLtd's earnings growth was more or les flat. So there might be other factors at play here which could potentially be hampering growth. For example, the business has faced some headwinds.
Only recently, Shenzhen Edadoc TechnologyLtd started paying a dividend. This means that the management might have concluded that its shareholders prefer dividends over earnings growth.
Summary
In total, we're a bit ambivalent about Shenzhen Edadoc TechnologyLtd's performance. Even though it appears to be retaining most of its profits, given the low ROE, investors may not be benefitting from all that reinvestment after all. The low earnings growth suggests our theory correct. So far, we've only made a quick discussion around the company's earnings growth. To gain further insights into Shenzhen Edadoc TechnologyLtd's past profit growth, check out this visualization of past earnings, revenue and cash flows.
New: Manage All Your Stock Portfolios in One Place
We've created the ultimate portfolio companion for stock investors, and it's free.
• Connect an unlimited number of Portfolios and see your total in one currency
• Be alerted to new Warning Signs or Risks via email or mobile
• Track the Fair Value of your stocks
Have feedback on this article? Concerned about the content? Get in touch with us directly. Alternatively, email editorial-team (at) simplywallst.com.
This article by Simply Wall St is general in nature. We provide commentary based on historical data and analyst forecasts only using an unbiased methodology and our articles are not intended to be financial advice. It does not constitute a recommendation to buy or sell any stock, and does not take account of your objectives, or your financial situation. We aim to bring you long-term focused analysis driven by fundamental data. Note that our analysis may not factor in the latest price-sensitive company announcements or qualitative material. Simply Wall St has no position in any stocks mentioned.
Have feedback on this article? Concerned about the content? Get in touch with us directly. Alternatively, email editorial-team@simplywallst.com
About SZSE:301366
Shenzhen Edadoc TechnologyLtd
Provides printed circuit board (PCB) design and PCB assembly manufacturing services in China and internationally.
Excellent balance sheet moderate.
Market Insights


Advertisement
Community Narratives
For the Emperor: Why Games Workshop Could Be a Star Investment
Fair Value UK£160.00|0.5% overvalued
RO
Community Contributor
Securitas will boost margins with AI and tech-driven services
Fair Value SEK 260.91|44.5% undervalued
UN
Community Contributor
A Leader in EV Charging with Growth Potential
Fair Value €27.00|18.7% undervalued
TI
Community Contributor