- China
- /
- Electronic Equipment and Components
- /
- SZSE:301282
Camelot Electronics Technology Co.,Ltd. (SZSE:301282) May Have Run Too Fast Too Soon With Recent 26% Price Plummet
To the annoyance of some shareholders, Camelot Electronics Technology Co.,Ltd. (SZSE:301282) shares are down a considerable 26% in the last month, which continues a horrid run for the company. The recent drop completes a disastrous twelve months for shareholders, who are sitting on a 54% loss during that time.
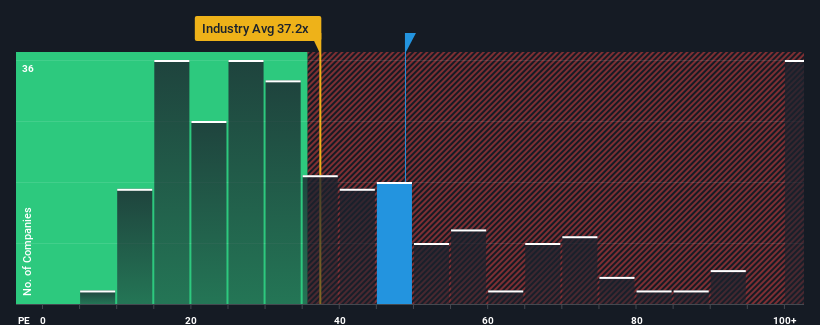
Even after such a large drop in price, Camelot Electronics TechnologyLtd's price-to-earnings (or "P/E") ratio of 48.8x might still make it look like a strong sell right now compared to the market in China, where around half of the companies have P/E ratios below 29x and even P/E's below 18x are quite common. However, the P/E might be quite high for a reason and it requires further investigation to determine if it's justified.
For example, consider that Camelot Electronics TechnologyLtd's financial performance has been poor lately as its earnings have been in decline. One possibility is that the P/E is high because investors think the company will still do enough to outperform the broader market in the near future. You'd really hope so, otherwise you're paying a pretty hefty price for no particular reason.
Check out our latest analysis for Camelot Electronics TechnologyLtd

Is There Enough Growth For Camelot Electronics TechnologyLtd?
Camelot Electronics TechnologyLtd's P/E ratio would be typical for a company that's expected to deliver very strong growth, and importantly, perform much better than the market.
If we review the last year of earnings, dishearteningly the company's profits fell to the tune of 75%. The last three years don't look nice either as the company has shrunk EPS by 54% in aggregate. Therefore, it's fair to say the earnings growth recently has been undesirable for the company.
Comparing that to the market, which is predicted to deliver 36% growth in the next 12 months, the company's downward momentum based on recent medium-term earnings results is a sobering picture.
With this information, we find it concerning that Camelot Electronics TechnologyLtd is trading at a P/E higher than the market. It seems most investors are ignoring the recent poor growth rate and are hoping for a turnaround in the company's business prospects. Only the boldest would assume these prices are sustainable as a continuation of recent earnings trends is likely to weigh heavily on the share price eventually.
What We Can Learn From Camelot Electronics TechnologyLtd's P/E?
Camelot Electronics TechnologyLtd's shares may have retreated, but its P/E is still flying high. While the price-to-earnings ratio shouldn't be the defining factor in whether you buy a stock or not, it's quite a capable barometer of earnings expectations.
We've established that Camelot Electronics TechnologyLtd currently trades on a much higher than expected P/E since its recent earnings have been in decline over the medium-term. When we see earnings heading backwards and underperforming the market forecasts, we suspect the share price is at risk of declining, sending the high P/E lower. If recent medium-term earnings trends continue, it will place shareholders' investments at significant risk and potential investors in danger of paying an excessive premium.
And what about other risks? Every company has them, and we've spotted 4 warning signs for Camelot Electronics TechnologyLtd (of which 1 can't be ignored!) you should know about.
Of course, you might also be able to find a better stock than Camelot Electronics TechnologyLtd. So you may wish to see this free collection of other companies that have reasonable P/E ratios and have grown earnings strongly.
New: AI Stock Screener & Alerts
Our new AI Stock Screener scans the market every day to uncover opportunities.
• Dividend Powerhouses (3%+ Yield)
• Undervalued Small Caps with Insider Buying
• High growth Tech and AI Companies
Or build your own from over 50 metrics.
Have feedback on this article? Concerned about the content? Get in touch with us directly. Alternatively, email editorial-team (at) simplywallst.com.
This article by Simply Wall St is general in nature. We provide commentary based on historical data and analyst forecasts only using an unbiased methodology and our articles are not intended to be financial advice. It does not constitute a recommendation to buy or sell any stock, and does not take account of your objectives, or your financial situation. We aim to bring you long-term focused analysis driven by fundamental data. Note that our analysis may not factor in the latest price-sensitive company announcements or qualitative material. Simply Wall St has no position in any stocks mentioned.
About SZSE:301282
Camelot Electronics TechnologyLtd
Engages in the research, production, and sale of printed circuit boards for intelligent electric vehicles in China and internationally.
Flawless balance sheet with acceptable track record.
Market Insights
Weekly Picks

Solutions by stc: 34% Upside in Saudi's Digital Transformation Leader


The AI Infrastructure Giant Grows Into Its Valuation
Recently Updated Narratives

Perdana Petroleum Berhad is a Zombie Business with a 27.34% Profit Margin and inflation adjusted revenue Business
Many trends acting at the same time


Engineered for Stability. Positioned for Growth.
Popular Narratives


MicroVision will explode future revenue by 380.37% with a vision towards success


NVDA: Expanding AI Demand Will Drive Major Data Center Investments Through 2026


