
Advertisement
- China
- /
- Electronic Equipment and Components
- /
- SZSE:301123
YD Electronic Technology Co.,Ltd.'s (SZSE:301123) Shares Bounce 29% But Its Business Still Trails The Industry
YD Electronic Technology Co.,Ltd. (SZSE:301123) shareholders have had their patience rewarded with a 29% share price jump in the last month. Unfortunately, the gains of the last month did little to right the losses of the last year with the stock still down 17% over that time.
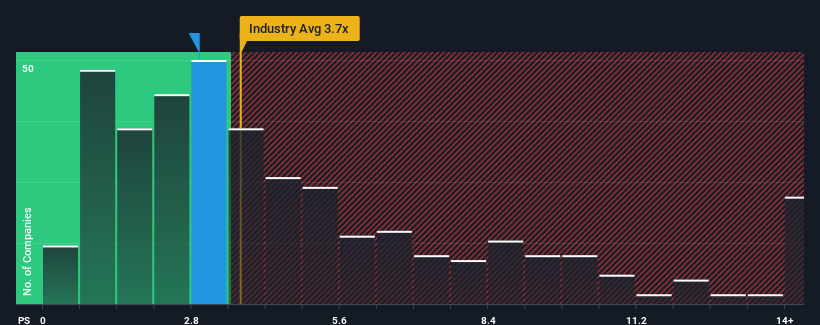
Even after such a large jump in price, YD Electronic TechnologyLtd may still be sending buy signals at present with its price-to-sales (or "P/S") ratio of 2.9x, considering almost half of all companies in the Electronic industry in China have P/S ratios greater than 3.7x and even P/S higher than 7x aren't out of the ordinary. However, the P/S might be low for a reason and it requires further investigation to determine if it's justified.
View our latest analysis for YD Electronic TechnologyLtd
How YD Electronic TechnologyLtd Has Been Performing
We'd have to say that with no tangible growth over the last year, YD Electronic TechnologyLtd's revenue has been unimpressive. Perhaps the market believes the recent lacklustre revenue performance is a sign of future underperformance relative to industry peers, hurting the P/S. Those who are bullish on YD Electronic TechnologyLtd will be hoping that this isn't the case, so that they can pick up the stock at a lower valuation.
We don't have analyst forecasts, but you can see how recent trends are setting up the company for the future by checking out our free report on YD Electronic TechnologyLtd's earnings, revenue and cash flow.What Are Revenue Growth Metrics Telling Us About The Low P/S?
There's an inherent assumption that a company should underperform the industry for P/S ratios like YD Electronic TechnologyLtd's to be considered reasonable.
Taking a look back first, we see that there was hardly any revenue growth to speak of for the company over the past year. Fortunately, a few good years before that means that it was still able to grow revenue by 23% in total over the last three years. Accordingly, shareholders probably wouldn't have been overly satisfied with the unstable medium-term growth rates.
This is in contrast to the rest of the industry, which is expected to grow by 26% over the next year, materially higher than the company's recent medium-term annualised growth rates.
With this information, we can see why YD Electronic TechnologyLtd is trading at a P/S lower than the industry. Apparently many shareholders weren't comfortable holding on to something they believe will continue to trail the wider industry.
What Does YD Electronic TechnologyLtd's P/S Mean For Investors?
Despite YD Electronic TechnologyLtd's share price climbing recently, its P/S still lags most other companies. Using the price-to-sales ratio alone to determine if you should sell your stock isn't sensible, however it can be a practical guide to the company's future prospects.
Our examination of YD Electronic TechnologyLtd confirms that the company's revenue trends over the past three-year years are a key factor in its low price-to-sales ratio, as we suspected, given they fall short of current industry expectations. Right now shareholders are accepting the low P/S as they concede future revenue probably won't provide any pleasant surprises. Unless the recent medium-term conditions improve, they will continue to form a barrier for the share price around these levels.
Don't forget that there may be other risks. For instance, we've identified 4 warning signs for YD Electronic TechnologyLtd (2 are significant) you should be aware of.
If you're unsure about the strength of YD Electronic TechnologyLtd's business, why not explore our interactive list of stocks with solid business fundamentals for some other companies you may have missed.
New: Manage All Your Stock Portfolios in One Place
We've created the ultimate portfolio companion for stock investors, and it's free.
• Connect an unlimited number of Portfolios and see your total in one currency
• Be alerted to new Warning Signs or Risks via email or mobile
• Track the Fair Value of your stocks
Have feedback on this article? Concerned about the content? Get in touch with us directly. Alternatively, email editorial-team (at) simplywallst.com.
This article by Simply Wall St is general in nature. We provide commentary based on historical data and analyst forecasts only using an unbiased methodology and our articles are not intended to be financial advice. It does not constitute a recommendation to buy or sell any stock, and does not take account of your objectives, or your financial situation. We aim to bring you long-term focused analysis driven by fundamental data. Note that our analysis may not factor in the latest price-sensitive company announcements or qualitative material. Simply Wall St has no position in any stocks mentioned.
About SZSE:301123
YD Electronic TechnologyLtd
Engages in the research and development, production, and sale of FPC boards, connector components, LED backlight modules, and other precision electronic components in China.
Excellent balance sheet with reasonable growth potential.
Market Insights

Advertisement
Community Narratives
Finding The True Value Of A Logistics Powerhouse
Fair Value US$95.21|7.5% undervalued
NV
Community Contributor
Paradigm Biopharmaceuticals Will Lead Osteoarthritis Treatment with Zilosul's FDA Success
Fair Value AU$5.50|93.3% undervalued
AM
Community Contributor
Barrick Mining (ABX:CA): A Gold Hedge against a U.S. Shutdown
Fair Value CA$60.00|26.4% undervalued
GM
Community Contributor