- China
- /
- Electronic Equipment and Components
- /
- SZSE:300975
Nanjing Sunlord Electronics Corporation Ltd. (SZSE:300975) Held Back By Insufficient Growth Even After Shares Climb 25%


Despite an already strong run, Nanjing Sunlord Electronics Corporation Ltd. (SZSE:300975) shares have been powering on, with a gain of 25% in the last thirty days. Looking back a bit further, it's encouraging to see the stock is up 78% in the last year.
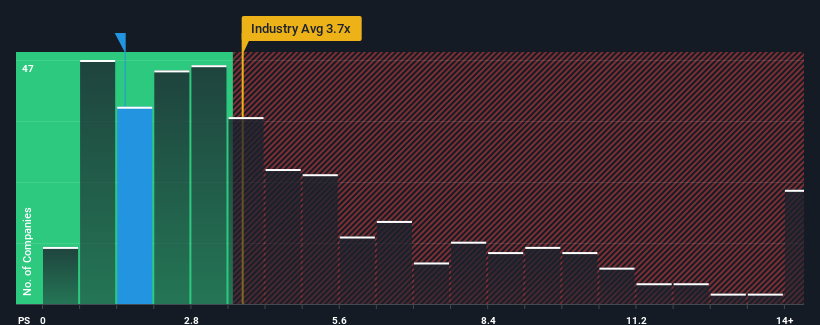
Although its price has surged higher, Nanjing Sunlord Electronics may still look like a strong buying opportunity at present with its price-to-sales (or "P/S") ratio of 1.5x, considering almost half of all companies in the Electronic industry in China have P/S ratios greater than 3.7x and even P/S higher than 7x aren't out of the ordinary. Although, it's not wise to just take the P/S at face value as there may be an explanation why it's so limited.
View our latest analysis for Nanjing Sunlord Electronics
How Has Nanjing Sunlord Electronics Performed Recently?
For instance, Nanjing Sunlord Electronics' receding revenue in recent times would have to be some food for thought. It might be that many expect the disappointing revenue performance to continue or accelerate, which has repressed the P/S. If you like the company, you'd be hoping this isn't the case so that you could potentially pick up some stock while it's out of favour.
We don't have analyst forecasts, but you can see how recent trends are setting up the company for the future by checking out our free report on Nanjing Sunlord Electronics' earnings, revenue and cash flow.Do Revenue Forecasts Match The Low P/S Ratio?
Nanjing Sunlord Electronics' P/S ratio would be typical for a company that's expected to deliver very poor growth or even falling revenue, and importantly, perform much worse than the industry.
Retrospectively, the last year delivered a frustrating 7.2% decrease to the company's top line. However, a few very strong years before that means that it was still able to grow revenue by an impressive 45% in total over the last three years. Accordingly, while they would have preferred to keep the run going, shareholders would definitely welcome the medium-term rates of revenue growth.
Comparing that to the industry, which is predicted to deliver 26% growth in the next 12 months, the company's momentum is weaker, based on recent medium-term annualised revenue results.
With this information, we can see why Nanjing Sunlord Electronics is trading at a P/S lower than the industry. Apparently many shareholders weren't comfortable holding on to something they believe will continue to trail the wider industry.
What Does Nanjing Sunlord Electronics' P/S Mean For Investors?
Shares in Nanjing Sunlord Electronics have risen appreciably however, its P/S is still subdued. We'd say the price-to-sales ratio's power isn't primarily as a valuation instrument but rather to gauge current investor sentiment and future expectations.
Our examination of Nanjing Sunlord Electronics confirms that the company's revenue trends over the past three-year years are a key factor in its low price-to-sales ratio, as we suspected, given they fall short of current industry expectations. At this stage investors feel the potential for an improvement in revenue isn't great enough to justify a higher P/S ratio. Unless the recent medium-term conditions improve, they will continue to form a barrier for the share price around these levels.
Don't forget that there may be other risks. For instance, we've identified 5 warning signs for Nanjing Sunlord Electronics (2 are a bit unpleasant) you should be aware of.
Of course, profitable companies with a history of great earnings growth are generally safer bets. So you may wish to see this free collection of other companies that have reasonable P/E ratios and have grown earnings strongly.
Valuation is complex, but we're here to simplify it.
Discover if Nanjing Sunlord Electronics might be undervalued or overvalued with our detailed analysis, featuring fair value estimates, potential risks, dividends, insider trades, and its financial condition.
Access Free AnalysisHave feedback on this article? Concerned about the content? Get in touch with us directly. Alternatively, email editorial-team (at) simplywallst.com.
This article by Simply Wall St is general in nature. We provide commentary based on historical data and analyst forecasts only using an unbiased methodology and our articles are not intended to be financial advice. It does not constitute a recommendation to buy or sell any stock, and does not take account of your objectives, or your financial situation. We aim to bring you long-term focused analysis driven by fundamental data. Note that our analysis may not factor in the latest price-sensitive company announcements or qualitative material. Simply Wall St has no position in any stocks mentioned.
About SZSE:300975
Acceptable track record with mediocre balance sheet.
Market Insights

Community Narratives

