- China
- /
- Electronic Equipment and Components
- /
- SZSE:300691
Is Union Optech Co.,Ltd.'s (SZSE:300691) Recent Price Movement Underpinned By Its Weak Fundamentals?

With its stock down 17% over the past three months, it is easy to disregard Union OptechLtd (SZSE:300691). It seems that the market might have completely ignored the positive aspects of the company's fundamentals and decided to weigh-in more on the negative aspects. Long-term fundamentals are usually what drive market outcomes, so it's worth paying close attention. Specifically, we decided to study Union OptechLtd's ROE in this article.
ROE or return on equity is a useful tool to assess how effectively a company can generate returns on the investment it received from its shareholders. In other words, it is a profitability ratio which measures the rate of return on the capital provided by the company's shareholders.
See our latest analysis for Union OptechLtd
How Is ROE Calculated?
The formula for return on equity is:
Return on Equity = Net Profit (from continuing operations) ÷ Shareholders' Equity
So, based on the above formula, the ROE for Union OptechLtd is:
3.4% = CN¥54m ÷ CN¥1.6b (Based on the trailing twelve months to March 2024).
The 'return' refers to a company's earnings over the last year. One way to conceptualize this is that for each CN¥1 of shareholders' capital it has, the company made CN¥0.03 in profit.
What Has ROE Got To Do With Earnings Growth?
We have already established that ROE serves as an efficient profit-generating gauge for a company's future earnings. We now need to evaluate how much profit the company reinvests or "retains" for future growth which then gives us an idea about the growth potential of the company. Generally speaking, other things being equal, firms with a high return on equity and profit retention, have a higher growth rate than firms that don’t share these attributes.
Union OptechLtd's Earnings Growth And 3.4% ROE
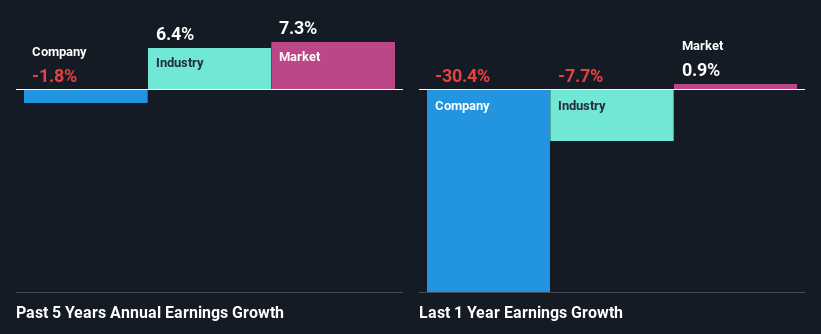
As you can see, Union OptechLtd's ROE looks pretty weak. Even when compared to the industry average of 6.3%, the ROE figure is pretty disappointing. Hence, the flat earnings seen by Union OptechLtd over the past five years could probably be the result of it having a lower ROE.
We then compared Union OptechLtd's net income growth with the industry and found that the average industry growth rate was 6.4% in the same 5-year period.
The basis for attaching value to a company is, to a great extent, tied to its earnings growth. The investor should try to establish if the expected growth or decline in earnings, whichever the case may be, is priced in. By doing so, they will have an idea if the stock is headed into clear blue waters or if swampy waters await. Is Union OptechLtd fairly valued compared to other companies? These 3 valuation measures might help you decide.
Is Union OptechLtd Making Efficient Use Of Its Profits?
In spite of a normal three-year median payout ratio of 46% (or a retention ratio of 54%), Union OptechLtd hasn't seen much growth in its earnings. So there might be other factors at play here which could potentially be hampering growth. For example, the business has faced some headwinds.
In addition, Union OptechLtd has been paying dividends over a period of six years suggesting that keeping up dividend payments is way more important to the management even if it comes at the cost of business growth.
Summary
In total, we're a bit ambivalent about Union OptechLtd's performance. Even though it appears to be retaining most of its profits, given the low ROE, investors may not be benefitting from all that reinvestment after all. The low earnings growth suggests our theory correct. Until now, we have only just grazed the surface of the company's past performance by looking at the company's fundamentals. To gain further insights into Union OptechLtd's past profit growth, check out this visualization of past earnings, revenue and cash flows.
Mobile Infrastructure for Defense and Disaster
The next wave in robotics isn't humanoid. Its fully autonomous towers delivering 5G, ISR, and radar in under 30 minutes, anywhere.
Get the investor briefing before the next round of contracts
Sponsored On Behalf of CiTechNew: AI Stock Screener & Alerts
Our new AI Stock Screener scans the market every day to uncover opportunities.
• Dividend Powerhouses (3%+ Yield)
• Undervalued Small Caps with Insider Buying
• High growth Tech and AI Companies
Or build your own from over 50 metrics.
Have feedback on this article? Concerned about the content? Get in touch with us directly. Alternatively, email editorial-team (at) simplywallst.com.
This article by Simply Wall St is general in nature. We provide commentary based on historical data and analyst forecasts only using an unbiased methodology and our articles are not intended to be financial advice. It does not constitute a recommendation to buy or sell any stock, and does not take account of your objectives, or your financial situation. We aim to bring you long-term focused analysis driven by fundamental data. Note that our analysis may not factor in the latest price-sensitive company announcements or qualitative material. Simply Wall St has no position in any stocks mentioned.
About SZSE:300691
Union OptechLtd
Designs, develops, manufactures, and sells optical lens in China.
Adequate balance sheet and slightly overvalued.
Market Insights

Weekly Picks

Early mover in a fast growing industry. Likely to experience share price volatility as they scale


A case for CA$31.80 (undiluted), aka 8,616% upside from CA$0.37 (an 86 bagger!).


Moderation and Stabilisation: HOLD: Fair Price based on a 4-year Cycle is $12.08
Recently Updated Narratives

Airbnb Stock: Platform Growth in a World of Saturation and Scrutiny

Clarivate Stock: When Data Becomes the Backbone of Innovation and Law

Adobe Stock: AI-Fueled ARR Growth Pushes Guidance Higher, But Cost Pressures Loom
Popular Narratives


Crazy Undervalued 42 Baggers Silver Play (Active & Running Mine)


NVDA: Expanding AI Demand Will Drive Major Data Center Investments Through 2026


MicroVision will explode future revenue by 380.37% with a vision towards success
Trending Discussion
